Senegalese vs New Zealander Unemployment Among Ages 30 to 34 years
COMPARE
Senegalese
New Zealander
Unemployment Among Ages 30 to 34 years
Unemployment Among Ages 30 to 34 years Comparison
Senegalese
New Zealanders
6.4%
UNEMPLOYMENT AMONG AGES 30 TO 34 YEARS
0.0/ 100
METRIC RATING
288th/ 347
METRIC RANK
5.3%
UNEMPLOYMENT AMONG AGES 30 TO 34 YEARS
82.5/ 100
METRIC RATING
119th/ 347
METRIC RANK
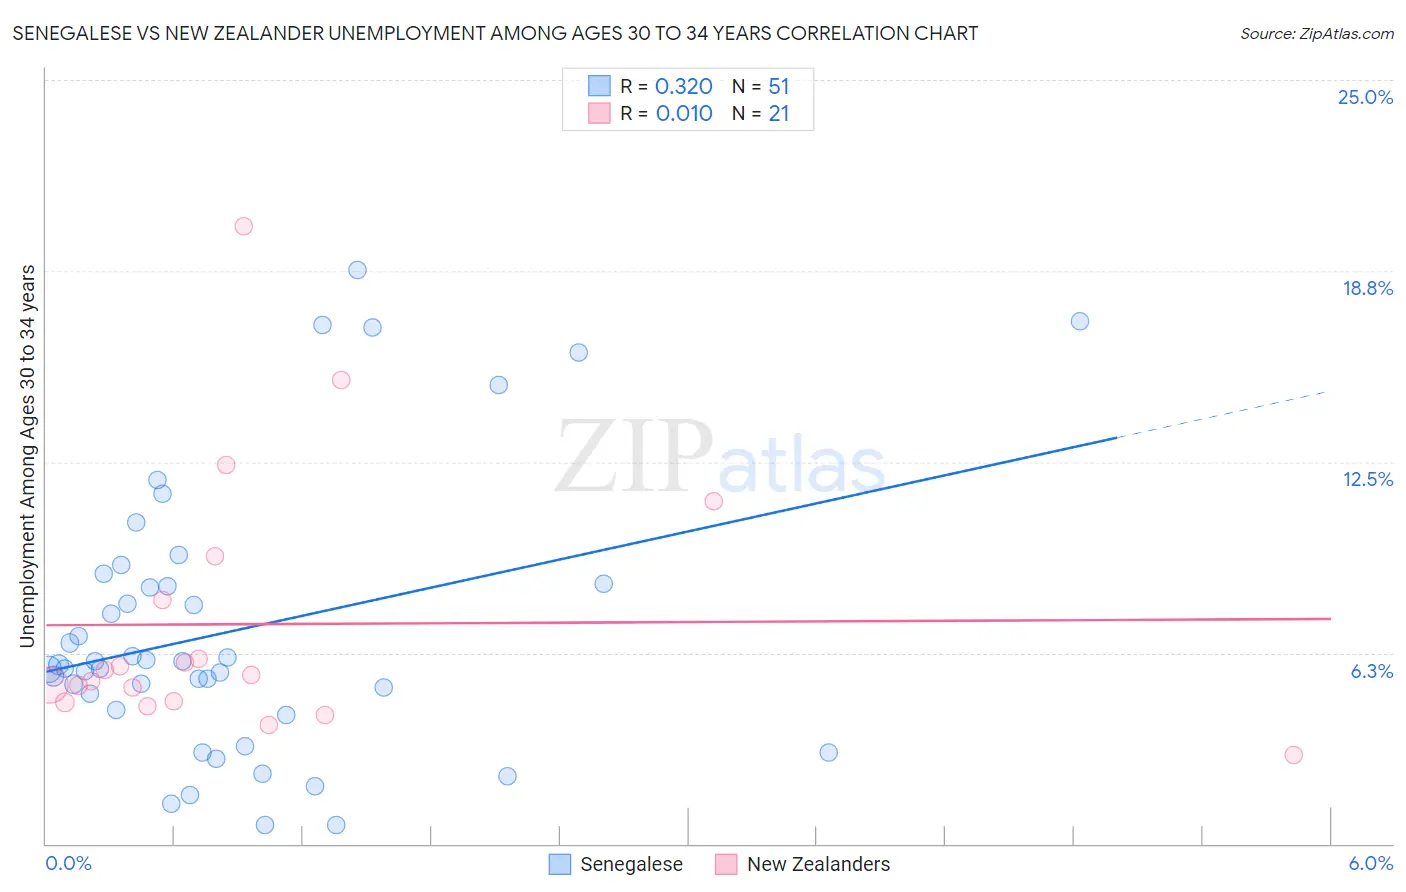
Senegalese vs New Zealander Unemployment Among Ages 30 to 34 years Correlation Chart
The statistical analysis conducted on geographies consisting of 77,308,775 people shows a mild positive correlation between the proportion of Senegalese and unemployment rate among population between the ages 30 and 34 in the United States with a correlation coefficient (R) of 0.320 and weighted average of 6.4%. Similarly, the statistical analysis conducted on geographies consisting of 104,776,009 people shows no correlation between the proportion of New Zealanders and unemployment rate among population between the ages 30 and 34 in the United States with a correlation coefficient (R) of 0.010 and weighted average of 5.3%, a difference of 21.1%.
Unemployment Among Ages 30 to 34 years Correlation Summary
| Measurement | Senegalese | New Zealander |
| Minimum | 0.60% | 2.9% |
| Maximum | 18.8% | 20.2% |
| Range | 18.2% | 17.3% |
| Mean | 7.0% | 7.2% |
| Median | 5.8% | 5.5% |
| Interquartile 25% (IQ1) | 4.4% | 4.6% |
| Interquartile 75% (IQ3) | 8.5% | 8.7% |
| Interquartile Range (IQR) | 4.1% | 4.0% |
| Standard Deviation (Sample) | 4.5% | 4.3% |
| Standard Deviation (Population) | 4.4% | 4.2% |
Similar Demographics by Unemployment Among Ages 30 to 34 years
Demographics Similar to Senegalese by Unemployment Among Ages 30 to 34 years
In terms of unemployment among ages 30 to 34 years, the demographic groups most similar to Senegalese are Immigrants from West Indies (6.4%, a difference of 0.040%), Menominee (6.4%, a difference of 0.040%), Central American Indian (6.4%, a difference of 0.060%), Choctaw (6.4%, a difference of 0.10%), and Immigrants from Bangladesh (6.4%, a difference of 0.20%).
| Demographics | Rating | Rank | Unemployment Among Ages 30 to 34 years |
| Immigrants | Caribbean | 0.0 /100 | #281 | Tragic 6.4% |
| Africans | 0.0 /100 | #282 | Tragic 6.4% |
| Hispanics or Latinos | 0.0 /100 | #283 | Tragic 6.4% |
| Immigrants | Bangladesh | 0.0 /100 | #284 | Tragic 6.4% |
| Choctaw | 0.0 /100 | #285 | Tragic 6.4% |
| Central American Indians | 0.0 /100 | #286 | Tragic 6.4% |
| Immigrants | West Indies | 0.0 /100 | #287 | Tragic 6.4% |
| Senegalese | 0.0 /100 | #288 | Tragic 6.4% |
| Menominee | 0.0 /100 | #289 | Tragic 6.4% |
| Immigrants | Trinidad and Tobago | 0.0 /100 | #290 | Tragic 6.5% |
| Jamaicans | 0.0 /100 | #291 | Tragic 6.5% |
| Vietnamese | 0.0 /100 | #292 | Tragic 6.5% |
| West Indians | 0.0 /100 | #293 | Tragic 6.5% |
| Barbadians | 0.0 /100 | #294 | Tragic 6.5% |
| Trinidadians and Tobagonians | 0.0 /100 | #295 | Tragic 6.5% |
Demographics Similar to New Zealanders by Unemployment Among Ages 30 to 34 years
In terms of unemployment among ages 30 to 34 years, the demographic groups most similar to New Zealanders are Immigrants from Poland (5.3%, a difference of 0.010%), Romanian (5.3%, a difference of 0.030%), Immigrants from South Africa (5.3%, a difference of 0.060%), Australian (5.3%, a difference of 0.070%), and Eastern European (5.3%, a difference of 0.080%).
| Demographics | Rating | Rank | Unemployment Among Ages 30 to 34 years |
| Swiss | 85.9 /100 | #112 | Excellent 5.3% |
| Immigrants | Spain | 85.6 /100 | #113 | Excellent 5.3% |
| Estonians | 83.7 /100 | #114 | Excellent 5.3% |
| Immigrants | Albania | 83.4 /100 | #115 | Excellent 5.3% |
| Eastern Europeans | 83.2 /100 | #116 | Excellent 5.3% |
| Australians | 83.1 /100 | #117 | Excellent 5.3% |
| Immigrants | South Africa | 83.0 /100 | #118 | Excellent 5.3% |
| New Zealanders | 82.5 /100 | #119 | Excellent 5.3% |
| Immigrants | Poland | 82.4 /100 | #120 | Excellent 5.3% |
| Romanians | 82.3 /100 | #121 | Excellent 5.3% |
| Immigrants | Netherlands | 81.8 /100 | #122 | Excellent 5.3% |
| Immigrants | Italy | 81.1 /100 | #123 | Excellent 5.3% |
| Immigrants | Brazil | 80.8 /100 | #124 | Excellent 5.3% |
| Greeks | 80.4 /100 | #125 | Excellent 5.3% |
| Immigrants | Sri Lanka | 80.2 /100 | #126 | Excellent 5.3% |