Marshallese vs Immigrants from Ukraine Unemployment Among Seniors over 75 years
COMPARE
Marshallese
Immigrants from Ukraine
Unemployment Among Seniors over 75 years
Unemployment Among Seniors over 75 years Comparison
Marshallese
Immigrants from Ukraine
8.2%
UNEMPLOYMENT AMONG SENIORS OVER 75 YEARS
98.7/ 100
METRIC RATING
110th/ 347
METRIC RANK
8.5%
UNEMPLOYMENT AMONG SENIORS OVER 75 YEARS
87.0/ 100
METRIC RATING
142nd/ 347
METRIC RANK
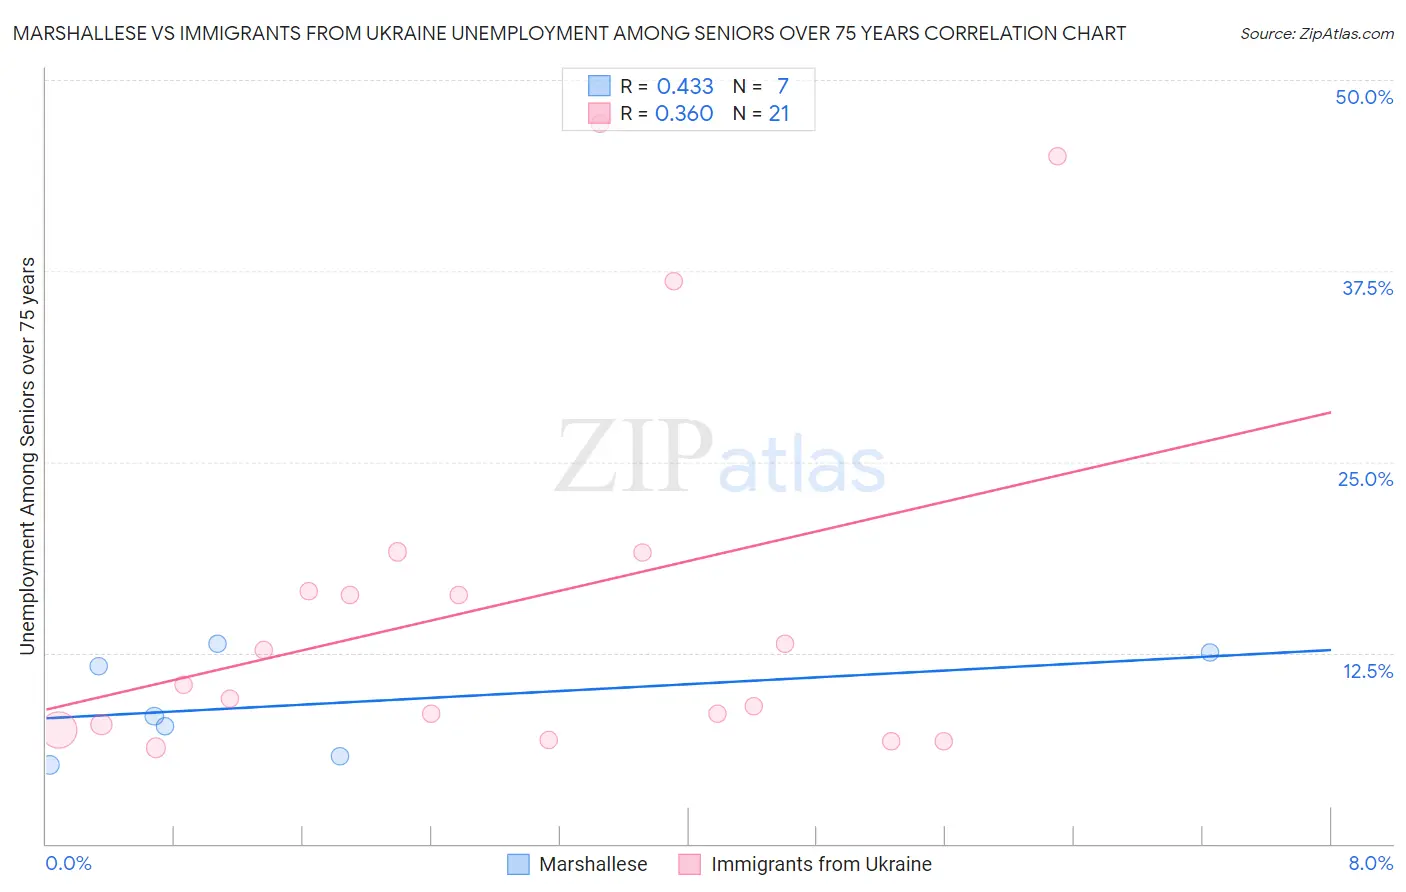
Marshallese vs Immigrants from Ukraine Unemployment Among Seniors over 75 years Correlation Chart
The statistical analysis conducted on geographies consisting of 10,692,551 people shows a moderate positive correlation between the proportion of Marshallese and unemployment rate among seniors over the age of 75 in the United States with a correlation coefficient (R) of 0.433 and weighted average of 8.2%. Similarly, the statistical analysis conducted on geographies consisting of 165,762,931 people shows a mild positive correlation between the proportion of Immigrants from Ukraine and unemployment rate among seniors over the age of 75 in the United States with a correlation coefficient (R) of 0.360 and weighted average of 8.5%, a difference of 3.5%.
Unemployment Among Seniors over 75 years Correlation Summary
| Measurement | Marshallese | Immigrants from Ukraine |
| Minimum | 5.2% | 6.3% |
| Maximum | 13.1% | 47.1% |
| Range | 7.9% | 40.8% |
| Mean | 9.2% | 15.7% |
| Median | 8.3% | 10.4% |
| Interquartile 25% (IQ1) | 5.7% | 7.6% |
| Interquartile 75% (IQ3) | 12.5% | 17.8% |
| Interquartile Range (IQR) | 6.8% | 10.2% |
| Standard Deviation (Sample) | 3.2% | 12.3% |
| Standard Deviation (Population) | 3.0% | 12.0% |
Similar Demographics by Unemployment Among Seniors over 75 years
Demographics Similar to Marshallese by Unemployment Among Seniors over 75 years
In terms of unemployment among seniors over 75 years, the demographic groups most similar to Marshallese are Immigrants from Lebanon (8.2%, a difference of 0.030%), Laotian (8.2%, a difference of 0.050%), French American Indian (8.2%, a difference of 0.050%), Immigrants from India (8.2%, a difference of 0.17%), and Sri Lankan (8.2%, a difference of 0.18%).
| Demographics | Rating | Rank | Unemployment Among Seniors over 75 years |
| South American Indians | 99.1 /100 | #103 | Exceptional 8.2% |
| Immigrants | South Central Asia | 99.0 /100 | #104 | Exceptional 8.2% |
| Immigrants | Caribbean | 99.0 /100 | #105 | Exceptional 8.2% |
| Immigrants | Honduras | 99.0 /100 | #106 | Exceptional 8.2% |
| Sri Lankans | 98.9 /100 | #107 | Exceptional 8.2% |
| Laotians | 98.8 /100 | #108 | Exceptional 8.2% |
| Immigrants | Lebanon | 98.8 /100 | #109 | Exceptional 8.2% |
| Marshallese | 98.7 /100 | #110 | Exceptional 8.2% |
| French American Indians | 98.7 /100 | #111 | Exceptional 8.2% |
| Immigrants | India | 98.6 /100 | #112 | Exceptional 8.2% |
| Asians | 98.5 /100 | #113 | Exceptional 8.3% |
| Trinidadians and Tobagonians | 98.4 /100 | #114 | Exceptional 8.3% |
| Sudanese | 98.2 /100 | #115 | Exceptional 8.3% |
| Immigrants | West Indies | 98.1 /100 | #116 | Exceptional 8.3% |
| Immigrants | Greece | 97.9 /100 | #117 | Exceptional 8.3% |
Demographics Similar to Immigrants from Ukraine by Unemployment Among Seniors over 75 years
In terms of unemployment among seniors over 75 years, the demographic groups most similar to Immigrants from Ukraine are Immigrants from Costa Rica (8.5%, a difference of 0.030%), Colombian (8.5%, a difference of 0.040%), Immigrants from Romania (8.5%, a difference of 0.090%), South American (8.5%, a difference of 0.11%), and Immigrants from Bolivia (8.5%, a difference of 0.11%).
| Demographics | Rating | Rank | Unemployment Among Seniors over 75 years |
| Haitians | 91.4 /100 | #135 | Exceptional 8.5% |
| Immigrants | Trinidad and Tobago | 90.8 /100 | #136 | Exceptional 8.5% |
| Immigrants | Kuwait | 90.5 /100 | #137 | Exceptional 8.5% |
| Immigrants | Bulgaria | 89.6 /100 | #138 | Excellent 8.5% |
| Barbadians | 88.6 /100 | #139 | Excellent 8.5% |
| South Americans | 87.9 /100 | #140 | Excellent 8.5% |
| Immigrants | Bolivia | 87.9 /100 | #141 | Excellent 8.5% |
| Immigrants | Ukraine | 87.0 /100 | #142 | Excellent 8.5% |
| Immigrants | Costa Rica | 86.8 /100 | #143 | Excellent 8.5% |
| Colombians | 86.7 /100 | #144 | Excellent 8.5% |
| Immigrants | Romania | 86.2 /100 | #145 | Excellent 8.5% |
| Immigrants | South Eastern Asia | 85.8 /100 | #146 | Excellent 8.5% |
| Immigrants | Sierra Leone | 85.6 /100 | #147 | Excellent 8.5% |
| Immigrants | Colombia | 85.6 /100 | #148 | Excellent 8.5% |
| Immigrants | Ecuador | 84.6 /100 | #149 | Excellent 8.5% |