Immigrants from Greece vs Immigrants from Peru Unemployment Among Ages 35 to 44 years
COMPARE
Immigrants from Greece
Immigrants from Peru
Unemployment Among Ages 35 to 44 years
Unemployment Among Ages 35 to 44 years Comparison
Immigrants from Greece
Immigrants from Peru
4.5%
UNEMPLOYMENT AMONG AGES 35 TO 44 YEARS
87.9/ 100
METRIC RATING
117th/ 347
METRIC RANK
4.7%
UNEMPLOYMENT AMONG AGES 35 TO 44 YEARS
39.9/ 100
METRIC RATING
180th/ 347
METRIC RANK
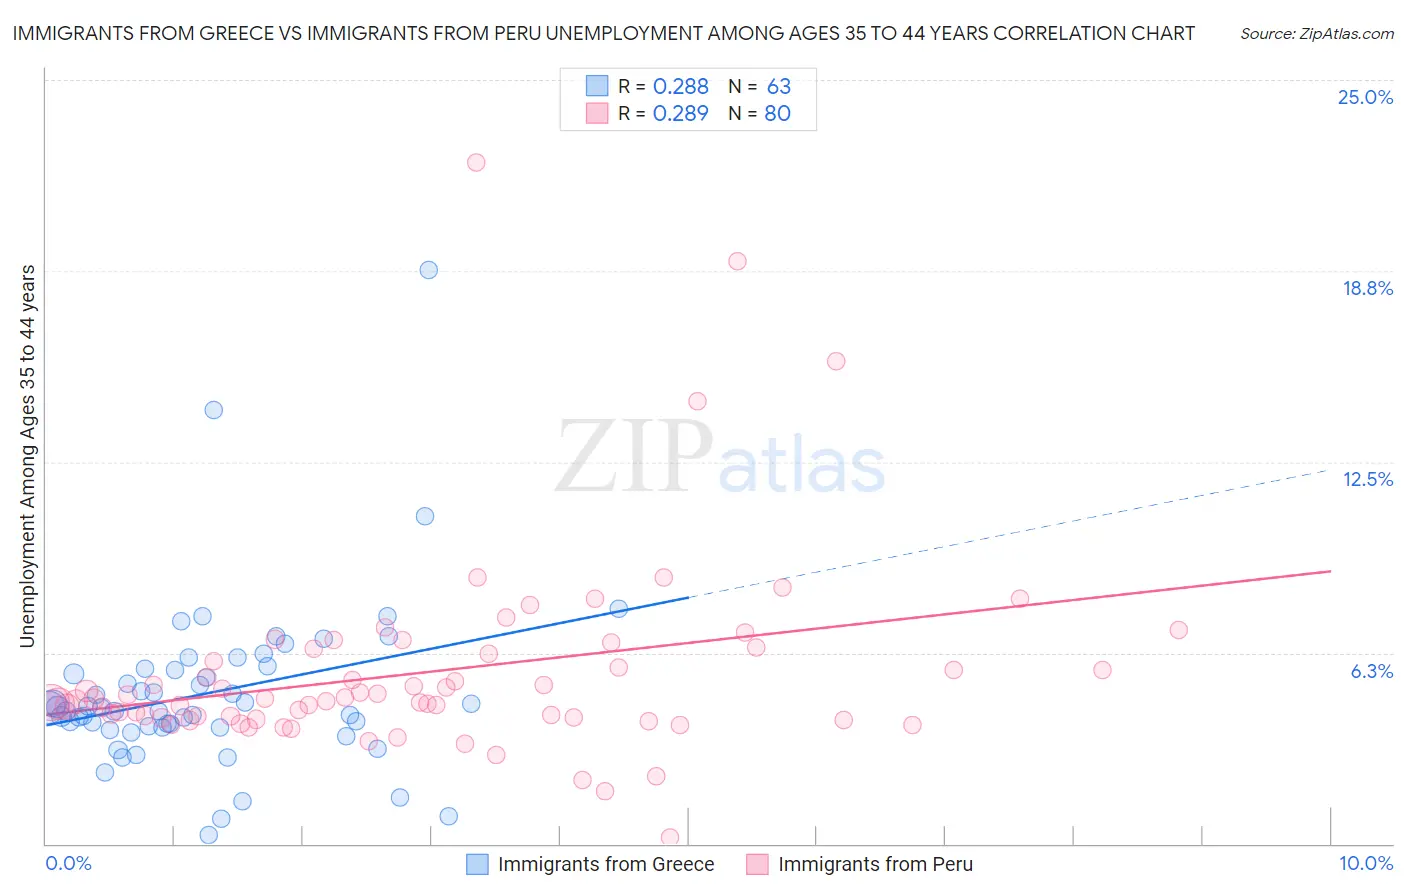
Immigrants from Greece vs Immigrants from Peru Unemployment Among Ages 35 to 44 years Correlation Chart
The statistical analysis conducted on geographies consisting of 214,208,810 people shows a weak positive correlation between the proportion of Immigrants from Greece and unemployment rate among population between the ages 35 and 44 in the United States with a correlation coefficient (R) of 0.288 and weighted average of 4.5%. Similarly, the statistical analysis conducted on geographies consisting of 324,077,342 people shows a weak positive correlation between the proportion of Immigrants from Peru and unemployment rate among population between the ages 35 and 44 in the United States with a correlation coefficient (R) of 0.289 and weighted average of 4.7%, a difference of 4.4%.
Unemployment Among Ages 35 to 44 years Correlation Summary
| Measurement | Immigrants from Greece | Immigrants from Peru |
| Minimum | 0.30% | 0.20% |
| Maximum | 18.8% | 22.3% |
| Range | 18.5% | 22.1% |
| Mean | 4.9% | 5.6% |
| Median | 4.5% | 4.7% |
| Interquartile 25% (IQ1) | 3.8% | 4.1% |
| Interquartile 75% (IQ3) | 5.7% | 6.3% |
| Interquartile Range (IQR) | 1.9% | 2.2% |
| Standard Deviation (Sample) | 2.8% | 3.3% |
| Standard Deviation (Population) | 2.8% | 3.3% |
Similar Demographics by Unemployment Among Ages 35 to 44 years
Demographics Similar to Immigrants from Greece by Unemployment Among Ages 35 to 44 years
In terms of unemployment among ages 35 to 44 years, the demographic groups most similar to Immigrants from Greece are Irish (4.5%, a difference of 0.010%), Immigrants from Israel (4.5%, a difference of 0.020%), Maltese (4.5%, a difference of 0.030%), Macedonian (4.5%, a difference of 0.060%), and Nicaraguan (4.5%, a difference of 0.060%).
| Demographics | Rating | Rank | Unemployment Among Ages 35 to 44 years |
| Immigrants | Kazakhstan | 90.0 /100 | #110 | Excellent 4.5% |
| Immigrants | Nicaragua | 89.8 /100 | #111 | Excellent 4.5% |
| Immigrants | Czechoslovakia | 89.2 /100 | #112 | Excellent 4.5% |
| Immigrants | Italy | 88.4 /100 | #113 | Excellent 4.5% |
| Macedonians | 88.3 /100 | #114 | Excellent 4.5% |
| Maltese | 88.1 /100 | #115 | Excellent 4.5% |
| Immigrants | Israel | 88.1 /100 | #116 | Excellent 4.5% |
| Immigrants | Greece | 87.9 /100 | #117 | Excellent 4.5% |
| Irish | 87.9 /100 | #118 | Excellent 4.5% |
| Nicaraguans | 87.6 /100 | #119 | Excellent 4.5% |
| Ethiopians | 87.1 /100 | #120 | Excellent 4.5% |
| Immigrants | South Africa | 86.8 /100 | #121 | Excellent 4.5% |
| Sri Lankans | 86.8 /100 | #122 | Excellent 4.5% |
| Basques | 86.3 /100 | #123 | Excellent 4.5% |
| Immigrants | Spain | 86.1 /100 | #124 | Excellent 4.5% |
Demographics Similar to Immigrants from Peru by Unemployment Among Ages 35 to 44 years
In terms of unemployment among ages 35 to 44 years, the demographic groups most similar to Immigrants from Peru are Immigrants from South Eastern Asia (4.7%, a difference of 0.020%), Brazilian (4.7%, a difference of 0.020%), South American Indian (4.7%, a difference of 0.060%), Israeli (4.7%, a difference of 0.10%), and Immigrants from Poland (4.7%, a difference of 0.15%).
| Demographics | Rating | Rank | Unemployment Among Ages 35 to 44 years |
| Iraqis | 50.9 /100 | #173 | Average 4.7% |
| Afghans | 50.0 /100 | #174 | Average 4.7% |
| Immigrants | Germany | 48.9 /100 | #175 | Average 4.7% |
| Immigrants | Uganda | 48.1 /100 | #176 | Average 4.7% |
| Slovaks | 44.6 /100 | #177 | Average 4.7% |
| South American Indians | 40.7 /100 | #178 | Average 4.7% |
| Immigrants | South Eastern Asia | 40.2 /100 | #179 | Average 4.7% |
| Immigrants | Peru | 39.9 /100 | #180 | Fair 4.7% |
| Brazilians | 39.5 /100 | #181 | Fair 4.7% |
| Israelis | 38.5 /100 | #182 | Fair 4.7% |
| Immigrants | Poland | 37.9 /100 | #183 | Fair 4.7% |
| Immigrants | Zaire | 37.3 /100 | #184 | Fair 4.7% |
| Immigrants | Costa Rica | 37.0 /100 | #185 | Fair 4.7% |
| Cypriots | 36.5 /100 | #186 | Fair 4.7% |
| Malaysians | 35.5 /100 | #187 | Fair 4.7% |