Immigrants from Greece vs Immigrants from Cuba Unemployment Among Women with Children Under 6 years
COMPARE
Immigrants from Greece
Immigrants from Cuba
Unemployment Among Women with Children Under 6 years
Unemployment Among Women with Children Under 6 years Comparison
Immigrants from Greece
Immigrants from Cuba
7.1%
UNEMPLOYMENT AMONG WOMEN WITH CHILDREN UNDER 6 YEARS
98.9/ 100
METRIC RATING
80th/ 347
METRIC RANK
6.7%
UNEMPLOYMENT AMONG WOMEN WITH CHILDREN UNDER 6 YEARS
99.9/ 100
METRIC RATING
42nd/ 347
METRIC RANK
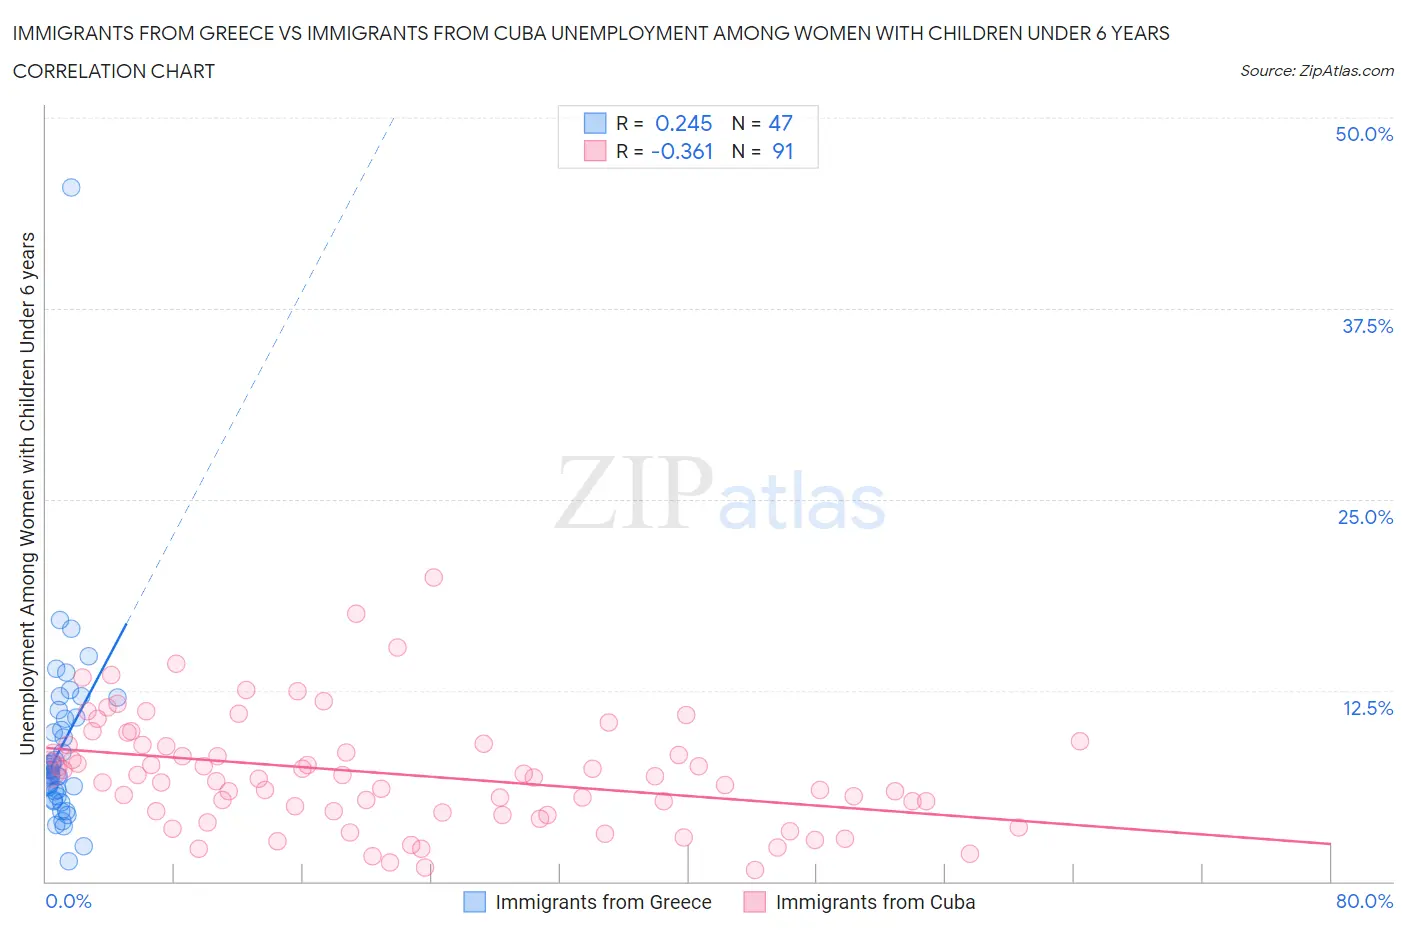
Immigrants from Greece vs Immigrants from Cuba Unemployment Among Women with Children Under 6 years Correlation Chart
The statistical analysis conducted on geographies consisting of 175,834,833 people shows a weak positive correlation between the proportion of Immigrants from Greece and unemployment rate among women with children under the age of 6 in the United States with a correlation coefficient (R) of 0.245 and weighted average of 7.1%. Similarly, the statistical analysis conducted on geographies consisting of 259,904,620 people shows a mild negative correlation between the proportion of Immigrants from Cuba and unemployment rate among women with children under the age of 6 in the United States with a correlation coefficient (R) of -0.361 and weighted average of 6.7%, a difference of 5.8%.
Unemployment Among Women with Children Under 6 years Correlation Summary
| Measurement | Immigrants from Greece | Immigrants from Cuba |
| Minimum | 1.3% | 0.70% |
| Maximum | 45.4% | 19.9% |
| Range | 44.1% | 19.2% |
| Mean | 8.8% | 7.0% |
| Median | 7.3% | 6.8% |
| Interquartile 25% (IQ1) | 5.6% | 4.5% |
| Interquartile 75% (IQ3) | 10.7% | 8.9% |
| Interquartile Range (IQR) | 5.1% | 4.4% |
| Standard Deviation (Sample) | 6.5% | 3.7% |
| Standard Deviation (Population) | 6.5% | 3.7% |
Similar Demographics by Unemployment Among Women with Children Under 6 years
Demographics Similar to Immigrants from Greece by Unemployment Among Women with Children Under 6 years
In terms of unemployment among women with children under 6 years, the demographic groups most similar to Immigrants from Greece are Immigrants from Fiji (7.1%, a difference of 0.020%), Immigrants from Venezuela (7.1%, a difference of 0.040%), Immigrants from Somalia (7.1%, a difference of 0.070%), Immigrants from Croatia (7.1%, a difference of 0.11%), and Estonian (7.1%, a difference of 0.15%).
| Demographics | Rating | Rank | Unemployment Among Women with Children Under 6 years |
| Immigrants | Czechoslovakia | 99.2 /100 | #73 | Exceptional 7.0% |
| Turks | 99.2 /100 | #74 | Exceptional 7.0% |
| Immigrants | Eastern Europe | 99.0 /100 | #75 | Exceptional 7.1% |
| Estonians | 99.0 /100 | #76 | Exceptional 7.1% |
| Immigrants | Croatia | 98.9 /100 | #77 | Exceptional 7.1% |
| Immigrants | Somalia | 98.9 /100 | #78 | Exceptional 7.1% |
| Immigrants | Fiji | 98.9 /100 | #79 | Exceptional 7.1% |
| Immigrants | Greece | 98.9 /100 | #80 | Exceptional 7.1% |
| Immigrants | Venezuela | 98.8 /100 | #81 | Exceptional 7.1% |
| Immigrants | Afghanistan | 98.7 /100 | #82 | Exceptional 7.1% |
| Egyptians | 98.7 /100 | #83 | Exceptional 7.1% |
| Immigrants | Albania | 98.7 /100 | #84 | Exceptional 7.1% |
| Immigrants | Romania | 98.7 /100 | #85 | Exceptional 7.1% |
| Immigrants | Zimbabwe | 98.6 /100 | #86 | Exceptional 7.1% |
| Alsatians | 98.4 /100 | #87 | Exceptional 7.1% |
Demographics Similar to Immigrants from Cuba by Unemployment Among Women with Children Under 6 years
In terms of unemployment among women with children under 6 years, the demographic groups most similar to Immigrants from Cuba are Immigrants from Indonesia (6.7%, a difference of 0.10%), Asian (6.7%, a difference of 0.26%), Bhutanese (6.7%, a difference of 0.28%), Immigrants from Russia (6.7%, a difference of 0.48%), and Hmong (6.7%, a difference of 0.54%).
| Demographics | Rating | Rank | Unemployment Among Women with Children Under 6 years |
| Yakama | 100.0 /100 | #35 | Exceptional 6.6% |
| Luxembourgers | 100.0 /100 | #36 | Exceptional 6.6% |
| Sri Lankans | 100.0 /100 | #37 | Exceptional 6.6% |
| Hmong | 100.0 /100 | #38 | Exceptional 6.7% |
| Immigrants | Russia | 100.0 /100 | #39 | Exceptional 6.7% |
| Asians | 100.0 /100 | #40 | Exceptional 6.7% |
| Immigrants | Indonesia | 99.9 /100 | #41 | Exceptional 6.7% |
| Immigrants | Cuba | 99.9 /100 | #42 | Exceptional 6.7% |
| Bhutanese | 99.9 /100 | #43 | Exceptional 6.7% |
| Iranians | 99.9 /100 | #44 | Exceptional 6.7% |
| Immigrants | Australia | 99.9 /100 | #45 | Exceptional 6.8% |
| Latvians | 99.9 /100 | #46 | Exceptional 6.8% |
| Immigrants | Asia | 99.9 /100 | #47 | Exceptional 6.8% |
| Immigrants | Switzerland | 99.9 /100 | #48 | Exceptional 6.8% |
| Immigrants | Nepal | 99.9 /100 | #49 | Exceptional 6.8% |