Ethiopian vs Native Hawaiian Unemployment Among Women with Children Under 6 years
COMPARE
Ethiopian
Native Hawaiian
Unemployment Among Women with Children Under 6 years
Unemployment Among Women with Children Under 6 years Comparison
Ethiopians
Native Hawaiians
6.8%
UNEMPLOYMENT AMONG WOMEN WITH CHILDREN UNDER 6 YEARS
99.9/ 100
METRIC RATING
51st/ 347
METRIC RANK
8.2%
UNEMPLOYMENT AMONG WOMEN WITH CHILDREN UNDER 6 YEARS
1.7/ 100
METRIC RATING
245th/ 347
METRIC RANK
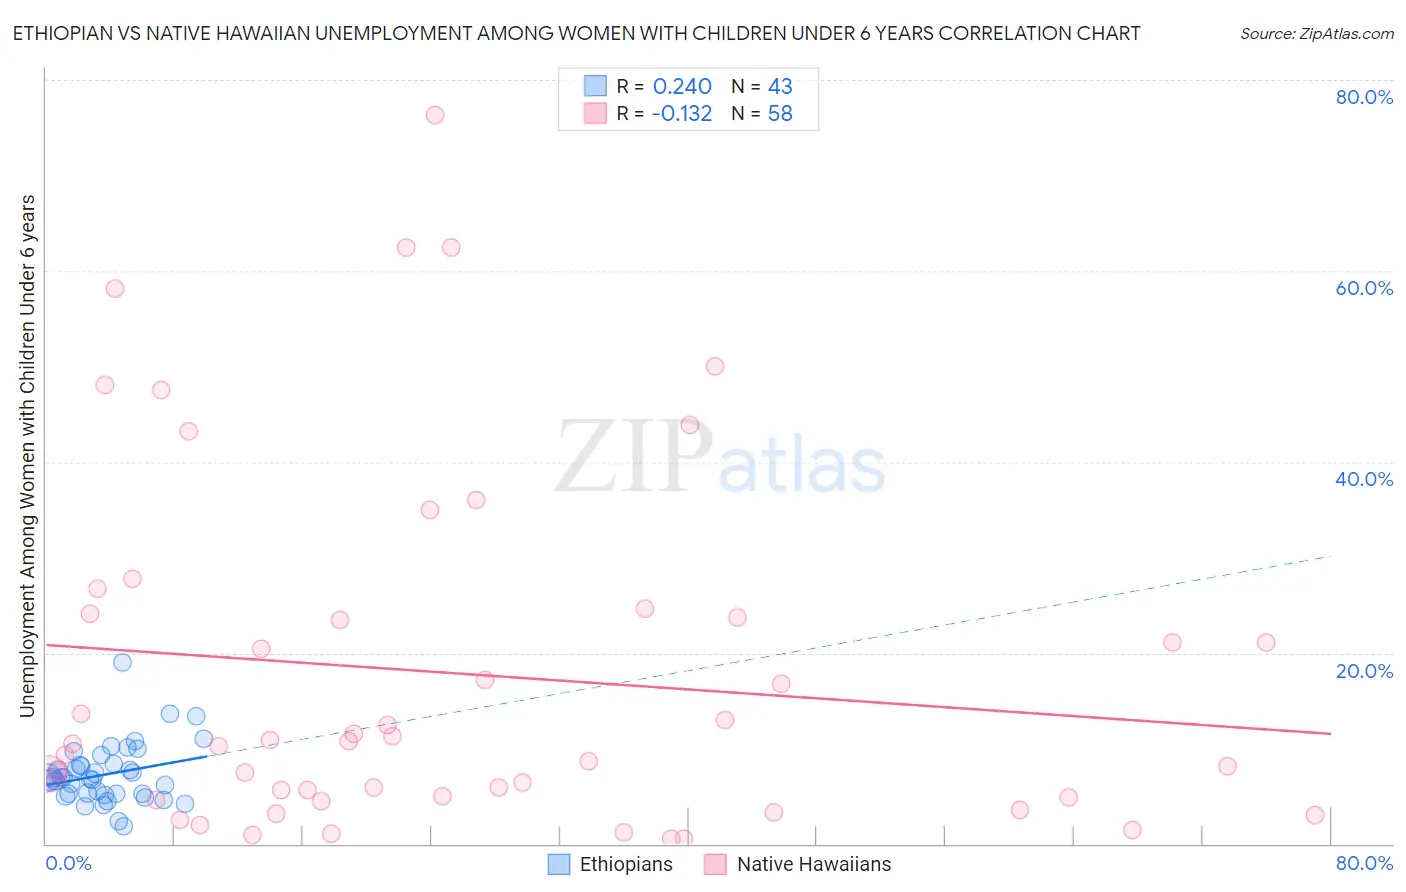
Ethiopian vs Native Hawaiian Unemployment Among Women with Children Under 6 years Correlation Chart
The statistical analysis conducted on geographies consisting of 190,123,801 people shows a weak positive correlation between the proportion of Ethiopians and unemployment rate among women with children under the age of 6 in the United States with a correlation coefficient (R) of 0.240 and weighted average of 6.8%. Similarly, the statistical analysis conducted on geographies consisting of 264,079,731 people shows a poor negative correlation between the proportion of Native Hawaiians and unemployment rate among women with children under the age of 6 in the United States with a correlation coefficient (R) of -0.132 and weighted average of 8.2%, a difference of 20.2%.
Unemployment Among Women with Children Under 6 years Correlation Summary
| Measurement | Ethiopian | Native Hawaiian |
| Minimum | 1.9% | 0.50% |
| Maximum | 19.0% | 76.4% |
| Range | 17.1% | 75.9% |
| Mean | 7.3% | 17.8% |
| Median | 6.9% | 10.6% |
| Interquartile 25% (IQ1) | 5.2% | 4.8% |
| Interquartile 75% (IQ3) | 8.4% | 24.1% |
| Interquartile Range (IQR) | 3.2% | 19.3% |
| Standard Deviation (Sample) | 3.2% | 18.5% |
| Standard Deviation (Population) | 3.1% | 18.4% |
Similar Demographics by Unemployment Among Women with Children Under 6 years
Demographics Similar to Ethiopians by Unemployment Among Women with Children Under 6 years
In terms of unemployment among women with children under 6 years, the demographic groups most similar to Ethiopians are Immigrants from Nepal (6.8%, a difference of 0.020%), Immigrants from Ireland (6.8%, a difference of 0.020%), Immigrants from Switzerland (6.8%, a difference of 0.080%), Immigrants from Asia (6.8%, a difference of 0.11%), and Immigrants from Iran (6.8%, a difference of 0.11%).
| Demographics | Rating | Rank | Unemployment Among Women with Children Under 6 years |
| Iranians | 99.9 /100 | #44 | Exceptional 6.7% |
| Immigrants | Australia | 99.9 /100 | #45 | Exceptional 6.8% |
| Latvians | 99.9 /100 | #46 | Exceptional 6.8% |
| Immigrants | Asia | 99.9 /100 | #47 | Exceptional 6.8% |
| Immigrants | Switzerland | 99.9 /100 | #48 | Exceptional 6.8% |
| Immigrants | Nepal | 99.9 /100 | #49 | Exceptional 6.8% |
| Immigrants | Ireland | 99.9 /100 | #50 | Exceptional 6.8% |
| Ethiopians | 99.9 /100 | #51 | Exceptional 6.8% |
| Immigrants | Iran | 99.9 /100 | #52 | Exceptional 6.8% |
| Chinese | 99.9 /100 | #53 | Exceptional 6.8% |
| Immigrants | Latvia | 99.9 /100 | #54 | Exceptional 6.8% |
| Immigrants | Ukraine | 99.8 /100 | #55 | Exceptional 6.8% |
| Immigrants | Ethiopia | 99.8 /100 | #56 | Exceptional 6.9% |
| Icelanders | 99.8 /100 | #57 | Exceptional 6.9% |
| Immigrants | Turkey | 99.8 /100 | #58 | Exceptional 6.9% |
Demographics Similar to Native Hawaiians by Unemployment Among Women with Children Under 6 years
In terms of unemployment among women with children under 6 years, the demographic groups most similar to Native Hawaiians are French (8.2%, a difference of 0.010%), Hawaiian (8.2%, a difference of 0.040%), Central American (8.2%, a difference of 0.33%), Dutch (8.1%, a difference of 0.59%), and German Russian (8.2%, a difference of 0.61%).
| Demographics | Rating | Rank | Unemployment Among Women with Children Under 6 years |
| Immigrants | Middle Africa | 3.2 /100 | #238 | Tragic 8.1% |
| Irish | 2.7 /100 | #239 | Tragic 8.1% |
| Immigrants | El Salvador | 2.6 /100 | #240 | Tragic 8.1% |
| Liberians | 2.6 /100 | #241 | Tragic 8.1% |
| Dutch | 2.5 /100 | #242 | Tragic 8.1% |
| Hawaiians | 1.8 /100 | #243 | Tragic 8.2% |
| French | 1.7 /100 | #244 | Tragic 8.2% |
| Native Hawaiians | 1.7 /100 | #245 | Tragic 8.2% |
| Central Americans | 1.4 /100 | #246 | Tragic 8.2% |
| German Russians | 1.2 /100 | #247 | Tragic 8.2% |
| Immigrants | Western Africa | 1.1 /100 | #248 | Tragic 8.2% |
| Immigrants | Sierra Leone | 1.1 /100 | #249 | Tragic 8.2% |
| Nigerians | 1.1 /100 | #250 | Tragic 8.2% |
| Guyanese | 1.0 /100 | #251 | Tragic 8.2% |
| Ghanaians | 1.0 /100 | #252 | Tragic 8.2% |