Immigrants from Greece vs Immigrants from Taiwan Unemployment Among Women with Children Ages 6 to 17 years
COMPARE
Immigrants from Greece
Immigrants from Taiwan
Unemployment Among Women with Children Ages 6 to 17 years
Unemployment Among Women with Children Ages 6 to 17 years Comparison
Immigrants from Greece
Immigrants from Taiwan
8.9%
UNEMPLOYMENT AMONG WOMEN WITH CHILDREN AGES 6 TO 17 YEARS
71.8/ 100
METRIC RATING
155th/ 347
METRIC RANK
7.3%
UNEMPLOYMENT AMONG WOMEN WITH CHILDREN AGES 6 TO 17 YEARS
100.0/ 100
METRIC RATING
11th/ 347
METRIC RANK
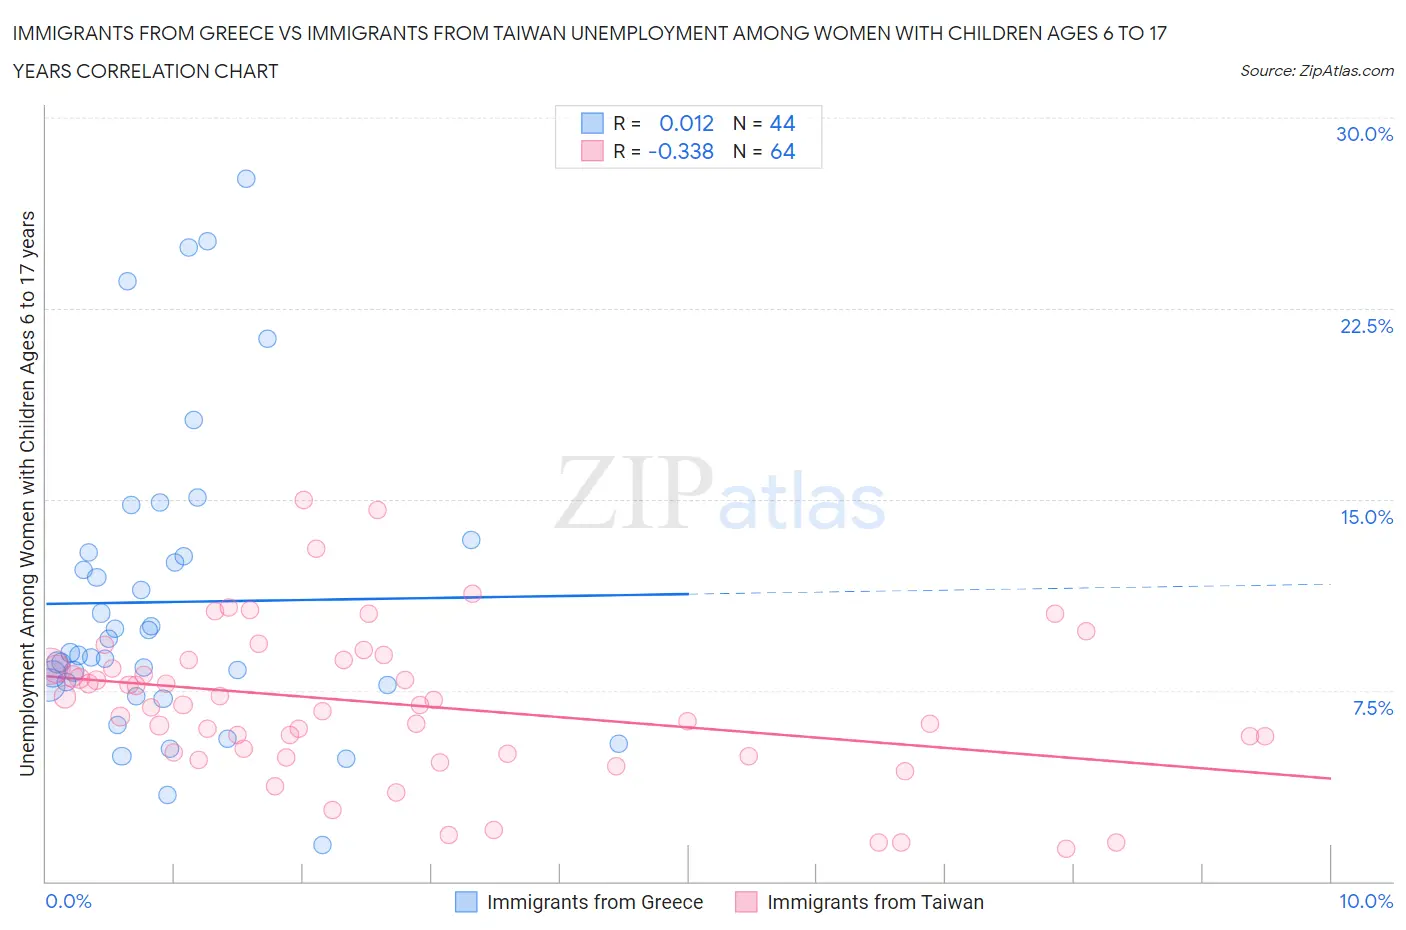
Immigrants from Greece vs Immigrants from Taiwan Unemployment Among Women with Children Ages 6 to 17 years Correlation Chart
The statistical analysis conducted on geographies consisting of 166,460,086 people shows no correlation between the proportion of Immigrants from Greece and unemployment rate among women with children between the ages 6 and 17 in the United States with a correlation coefficient (R) of 0.012 and weighted average of 8.9%. Similarly, the statistical analysis conducted on geographies consisting of 225,183,414 people shows a mild negative correlation between the proportion of Immigrants from Taiwan and unemployment rate among women with children between the ages 6 and 17 in the United States with a correlation coefficient (R) of -0.338 and weighted average of 7.3%, a difference of 21.0%.
Unemployment Among Women with Children Ages 6 to 17 years Correlation Summary
| Measurement | Immigrants from Greece | Immigrants from Taiwan |
| Minimum | 1.4% | 1.3% |
| Maximum | 27.6% | 15.0% |
| Range | 26.2% | 13.7% |
| Mean | 11.0% | 6.9% |
| Median | 8.9% | 6.9% |
| Interquartile 25% (IQ1) | 7.7% | 5.0% |
| Interquartile 75% (IQ3) | 12.8% | 8.6% |
| Interquartile Range (IQR) | 5.1% | 3.5% |
| Standard Deviation (Sample) | 5.9% | 3.0% |
| Standard Deviation (Population) | 5.9% | 3.0% |
Similar Demographics by Unemployment Among Women with Children Ages 6 to 17 years
Demographics Similar to Immigrants from Greece by Unemployment Among Women with Children Ages 6 to 17 years
In terms of unemployment among women with children ages 6 to 17 years, the demographic groups most similar to Immigrants from Greece are Vietnamese (8.9%, a difference of 0.020%), Immigrants from Europe (8.9%, a difference of 0.090%), Immigrants from Eastern Africa (8.9%, a difference of 0.16%), Immigrants from Northern Europe (8.9%, a difference of 0.16%), and Greek (8.9%, a difference of 0.20%).
| Demographics | Rating | Rank | Unemployment Among Women with Children Ages 6 to 17 years |
| Costa Ricans | 77.0 /100 | #148 | Good 8.8% |
| Croatians | 76.0 /100 | #149 | Good 8.8% |
| Greeks | 75.2 /100 | #150 | Good 8.9% |
| Immigrants | Eastern Africa | 74.6 /100 | #151 | Good 8.9% |
| Immigrants | Northern Europe | 74.6 /100 | #152 | Good 8.9% |
| Immigrants | Europe | 73.4 /100 | #153 | Good 8.9% |
| Vietnamese | 72.1 /100 | #154 | Good 8.9% |
| Immigrants | Greece | 71.8 /100 | #155 | Good 8.9% |
| Osage | 65.9 /100 | #156 | Good 8.9% |
| Immigrants | Belgium | 65.6 /100 | #157 | Good 8.9% |
| Immigrants | Chile | 65.3 /100 | #158 | Good 8.9% |
| Spanish | 63.8 /100 | #159 | Good 8.9% |
| Immigrants | Hungary | 63.4 /100 | #160 | Good 8.9% |
| Immigrants | Guyana | 63.0 /100 | #161 | Good 8.9% |
| Immigrants | Netherlands | 60.8 /100 | #162 | Good 8.9% |
Demographics Similar to Immigrants from Taiwan by Unemployment Among Women with Children Ages 6 to 17 years
In terms of unemployment among women with children ages 6 to 17 years, the demographic groups most similar to Immigrants from Taiwan are Bangladeshi (7.4%, a difference of 0.33%), Immigrants from Fiji (7.3%, a difference of 0.70%), Indonesian (7.4%, a difference of 1.0%), Sudanese (7.4%, a difference of 1.1%), and Assyrian/Chaldean/Syriac (7.2%, a difference of 1.7%).
| Demographics | Rating | Rank | Unemployment Among Women with Children Ages 6 to 17 years |
| Ute | 100.0 /100 | #4 | Exceptional 7.0% |
| Okinawans | 100.0 /100 | #5 | Exceptional 7.0% |
| Tlingit-Haida | 100.0 /100 | #6 | Exceptional 7.1% |
| Soviet Union | 100.0 /100 | #7 | Exceptional 7.1% |
| Immigrants | Hong Kong | 100.0 /100 | #8 | Exceptional 7.2% |
| Assyrians/Chaldeans/Syriacs | 100.0 /100 | #9 | Exceptional 7.2% |
| Immigrants | Fiji | 100.0 /100 | #10 | Exceptional 7.3% |
| Immigrants | Taiwan | 100.0 /100 | #11 | Exceptional 7.3% |
| Bangladeshis | 100.0 /100 | #12 | Exceptional 7.4% |
| Indonesians | 100.0 /100 | #13 | Exceptional 7.4% |
| Sudanese | 100.0 /100 | #14 | Exceptional 7.4% |
| Puget Sound Salish | 100.0 /100 | #15 | Exceptional 7.5% |
| Immigrants | Burma/Myanmar | 100.0 /100 | #16 | Exceptional 7.5% |
| Cambodians | 100.0 /100 | #17 | Exceptional 7.5% |
| Afghans | 100.0 /100 | #18 | Exceptional 7.6% |