Immigrants from Ghana vs Immigrants from Uruguay Unemployment Among Youth under 25 years
COMPARE
Immigrants from Ghana
Immigrants from Uruguay
Unemployment Among Youth under 25 years
Unemployment Among Youth under 25 years Comparison
Immigrants from Ghana
Immigrants from Uruguay
13.4%
UNEMPLOYMENT AMONG YOUTH UNDER 25 YEARS
0.0/ 100
METRIC RATING
289th/ 347
METRIC RANK
11.5%
UNEMPLOYMENT AMONG YOUTH UNDER 25 YEARS
76.1/ 100
METRIC RATING
141st/ 347
METRIC RANK
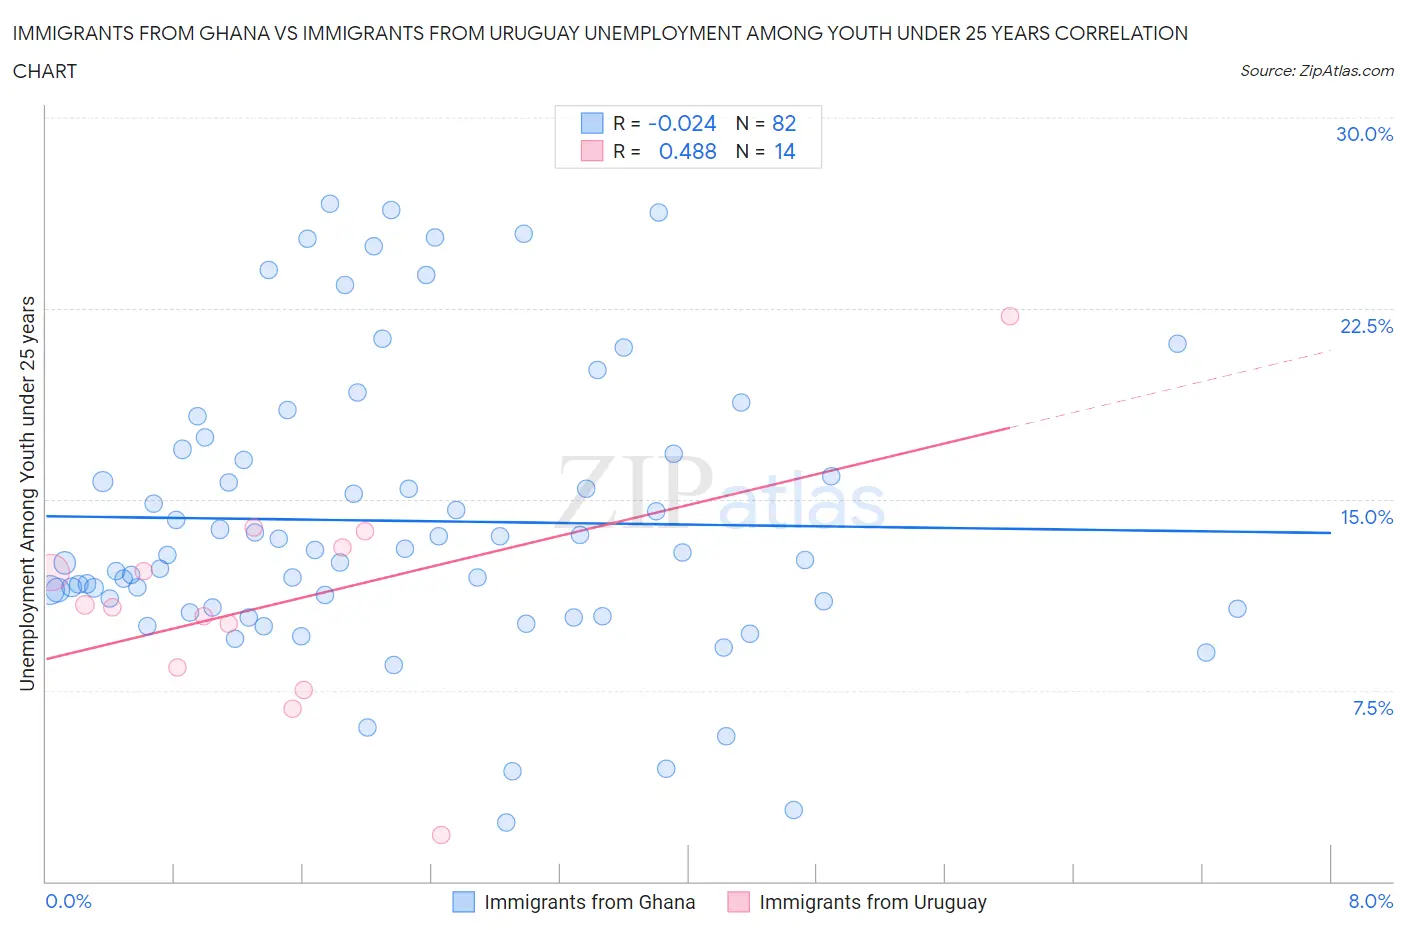
Immigrants from Ghana vs Immigrants from Uruguay Unemployment Among Youth under 25 years Correlation Chart
The statistical analysis conducted on geographies consisting of 199,301,284 people shows no correlation between the proportion of Immigrants from Ghana and unemployment rate among youth under the age of 25 in the United States with a correlation coefficient (R) of -0.024 and weighted average of 13.4%. Similarly, the statistical analysis conducted on geographies consisting of 132,844,983 people shows a moderate positive correlation between the proportion of Immigrants from Uruguay and unemployment rate among youth under the age of 25 in the United States with a correlation coefficient (R) of 0.488 and weighted average of 11.5%, a difference of 16.7%.
Unemployment Among Youth under 25 years Correlation Summary
| Measurement | Immigrants from Ghana | Immigrants from Uruguay |
| Minimum | 2.3% | 1.8% |
| Maximum | 26.6% | 22.2% |
| Range | 24.3% | 20.4% |
| Mean | 14.2% | 11.0% |
| Median | 12.9% | 10.8% |
| Interquartile 25% (IQ1) | 10.7% | 8.4% |
| Interquartile 75% (IQ3) | 16.8% | 13.1% |
| Interquartile Range (IQR) | 6.1% | 4.7% |
| Standard Deviation (Sample) | 5.6% | 4.6% |
| Standard Deviation (Population) | 5.5% | 4.4% |
Similar Demographics by Unemployment Among Youth under 25 years
Demographics Similar to Immigrants from Ghana by Unemployment Among Youth under 25 years
In terms of unemployment among youth under 25 years, the demographic groups most similar to Immigrants from Ghana are Immigrants from Western Africa (13.4%, a difference of 0.11%), Immigrants from Ecuador (13.4%, a difference of 0.34%), Ecuadorian (13.3%, a difference of 0.54%), Blackfeet (13.3%, a difference of 0.55%), and Ghanaian (13.3%, a difference of 0.60%).
| Demographics | Rating | Rank | Unemployment Among Youth under 25 years |
| Sierra Leoneans | 0.0 /100 | #282 | Tragic 13.3% |
| Immigrants | Cameroon | 0.0 /100 | #283 | Tragic 13.3% |
| Lumbee | 0.0 /100 | #284 | Tragic 13.3% |
| Ghanaians | 0.0 /100 | #285 | Tragic 13.3% |
| Blackfeet | 0.0 /100 | #286 | Tragic 13.3% |
| Ecuadorians | 0.0 /100 | #287 | Tragic 13.3% |
| Immigrants | Western Africa | 0.0 /100 | #288 | Tragic 13.4% |
| Immigrants | Ghana | 0.0 /100 | #289 | Tragic 13.4% |
| Immigrants | Ecuador | 0.0 /100 | #290 | Tragic 13.4% |
| Apache | 0.0 /100 | #291 | Tragic 13.5% |
| Central American Indians | 0.0 /100 | #292 | Tragic 13.5% |
| Spanish American Indians | 0.0 /100 | #293 | Tragic 13.5% |
| Immigrants | Caribbean | 0.0 /100 | #294 | Tragic 13.5% |
| Chippewa | 0.0 /100 | #295 | Tragic 13.5% |
| Senegalese | 0.0 /100 | #296 | Tragic 13.5% |
Demographics Similar to Immigrants from Uruguay by Unemployment Among Youth under 25 years
In terms of unemployment among youth under 25 years, the demographic groups most similar to Immigrants from Uruguay are Immigrants from Korea (11.5%, a difference of 0.050%), Immigrants from Indonesia (11.5%, a difference of 0.090%), Immigrants from Belgium (11.5%, a difference of 0.090%), Immigrants from Uganda (11.5%, a difference of 0.090%), and Immigrants from Brazil (11.5%, a difference of 0.10%).
| Demographics | Rating | Rank | Unemployment Among Youth under 25 years |
| Immigrants | Chile | 80.4 /100 | #134 | Excellent 11.4% |
| Immigrants | Oceania | 80.2 /100 | #135 | Excellent 11.4% |
| Romanians | 80.1 /100 | #136 | Excellent 11.4% |
| Asians | 79.7 /100 | #137 | Good 11.4% |
| Immigrants | England | 78.1 /100 | #138 | Good 11.5% |
| Immigrants | Indonesia | 77.6 /100 | #139 | Good 11.5% |
| Immigrants | Belgium | 77.5 /100 | #140 | Good 11.5% |
| Immigrants | Uruguay | 76.1 /100 | #141 | Good 11.5% |
| Immigrants | Korea | 75.1 /100 | #142 | Good 11.5% |
| Immigrants | Uganda | 74.5 /100 | #143 | Good 11.5% |
| Immigrants | Brazil | 74.3 /100 | #144 | Good 11.5% |
| Argentineans | 73.0 /100 | #145 | Good 11.5% |
| Brazilians | 72.5 /100 | #146 | Good 11.5% |
| Laotians | 72.4 /100 | #147 | Good 11.5% |
| Immigrants | Northern Europe | 72.1 /100 | #148 | Good 11.5% |