Immigrants from France vs Immigrants from Hong Kong Unemployment Among Ages 30 to 34 years
COMPARE
Immigrants from France
Immigrants from Hong Kong
Unemployment Among Ages 30 to 34 years
Unemployment Among Ages 30 to 34 years Comparison
Immigrants from France
Immigrants from Hong Kong
5.1%
UNEMPLOYMENT AMONG AGES 30 TO 34 YEARS
97.0/ 100
METRIC RATING
62nd/ 347
METRIC RANK
5.0%
UNEMPLOYMENT AMONG AGES 30 TO 34 YEARS
98.8/ 100
METRIC RATING
42nd/ 347
METRIC RANK
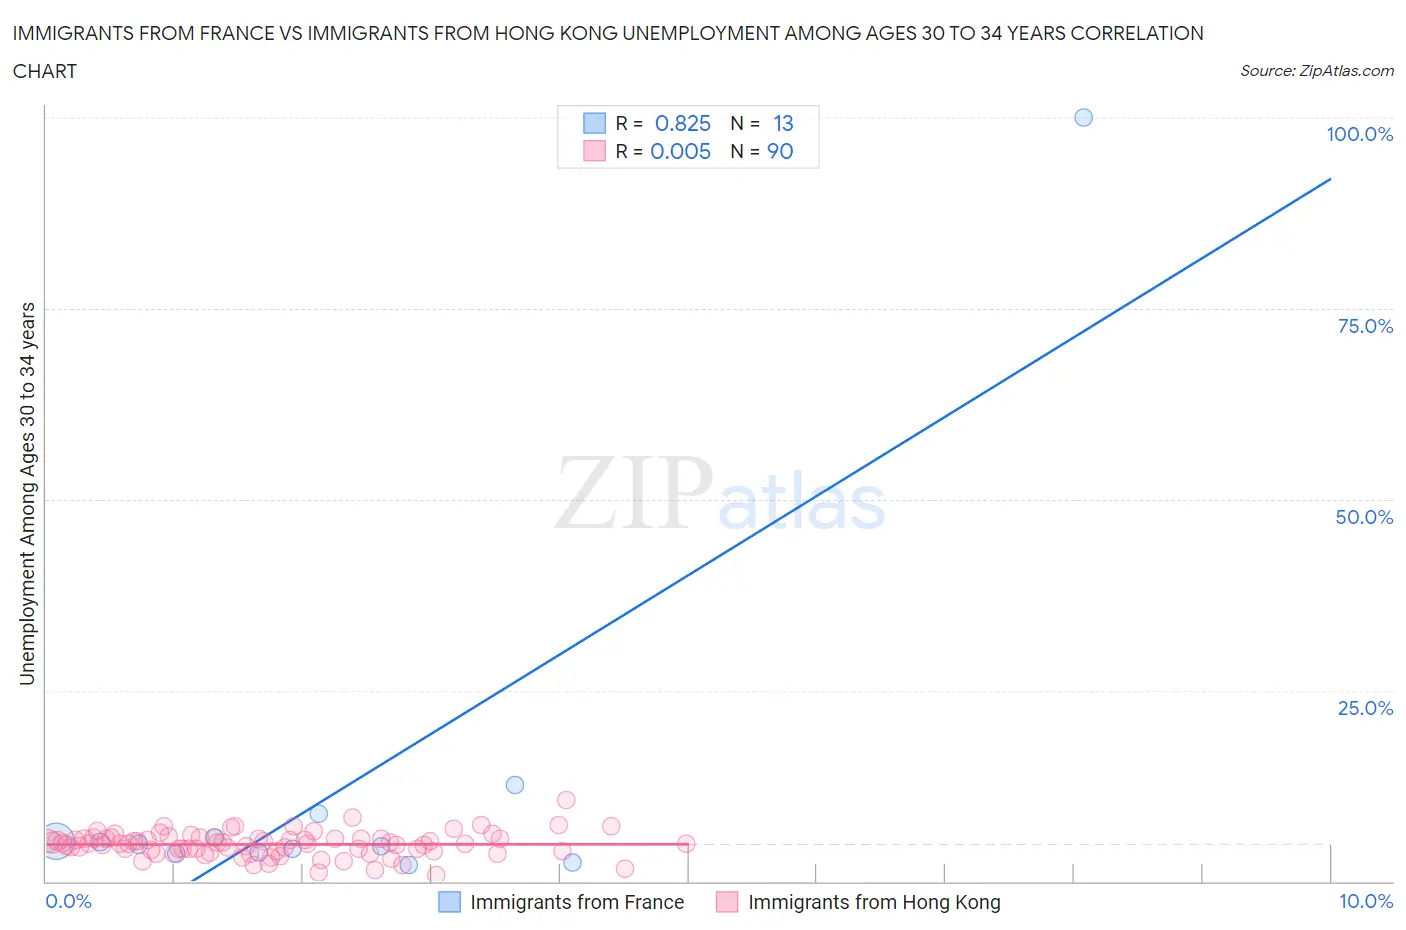
Immigrants from France vs Immigrants from Hong Kong Unemployment Among Ages 30 to 34 years Correlation Chart
The statistical analysis conducted on geographies consisting of 276,101,474 people shows a very strong positive correlation between the proportion of Immigrants from France and unemployment rate among population between the ages 30 and 34 in the United States with a correlation coefficient (R) of 0.825 and weighted average of 5.1%. Similarly, the statistical analysis conducted on geographies consisting of 245,493,498 people shows no correlation between the proportion of Immigrants from Hong Kong and unemployment rate among population between the ages 30 and 34 in the United States with a correlation coefficient (R) of 0.005 and weighted average of 5.0%, a difference of 1.8%.
Unemployment Among Ages 30 to 34 years Correlation Summary
| Measurement | Immigrants from France | Immigrants from Hong Kong |
| Minimum | 2.2% | 0.90% |
| Maximum | 100.0% | 10.6% |
| Range | 97.8% | 9.7% |
| Mean | 12.6% | 4.8% |
| Median | 4.8% | 4.9% |
| Interquartile 25% (IQ1) | 3.7% | 4.0% |
| Interquartile 75% (IQ3) | 7.2% | 5.6% |
| Interquartile Range (IQR) | 3.5% | 1.6% |
| Standard Deviation (Sample) | 26.4% | 1.6% |
| Standard Deviation (Population) | 25.4% | 1.6% |
Demographics Similar to Immigrants from France and Immigrants from Hong Kong by Unemployment Among Ages 30 to 34 years
In terms of unemployment among ages 30 to 34 years, the demographic groups most similar to Immigrants from France are Indian (Asian) (5.1%, a difference of 0.020%), Swedish (5.1%, a difference of 0.050%), Immigrants from Somalia (5.1%, a difference of 0.050%), Immigrants from China (5.1%, a difference of 0.14%), and Asian (5.1%, a difference of 0.14%). Similarly, the demographic groups most similar to Immigrants from Hong Kong are Soviet Union (5.0%, a difference of 0.10%), Immigrants from Belgium (5.1%, a difference of 0.25%), Yugoslavian (5.1%, a difference of 0.28%), Immigrants from Congo (5.1%, a difference of 0.58%), and Cypriot (5.1%, a difference of 0.61%).
| Demographics | Rating | Rank | Unemployment Among Ages 30 to 34 years |
| Immigrants | Hong Kong | 98.8 /100 | #42 | Exceptional 5.0% |
| Soviet Union | 98.8 /100 | #43 | Exceptional 5.0% |
| Immigrants | Belgium | 98.7 /100 | #44 | Exceptional 5.1% |
| Yugoslavians | 98.6 /100 | #45 | Exceptional 5.1% |
| Immigrants | Congo | 98.4 /100 | #46 | Exceptional 5.1% |
| Cypriots | 98.4 /100 | #47 | Exceptional 5.1% |
| Assyrians/Chaldeans/Syriacs | 98.4 /100 | #48 | Exceptional 5.1% |
| Immigrants | Malaysia | 98.3 /100 | #49 | Exceptional 5.1% |
| Puget Sound Salish | 98.2 /100 | #50 | Exceptional 5.1% |
| Turks | 98.2 /100 | #51 | Exceptional 5.1% |
| Immigrants | Burma/Myanmar | 98.1 /100 | #52 | Exceptional 5.1% |
| Cubans | 98.1 /100 | #53 | Exceptional 5.1% |
| Immigrants | Morocco | 97.9 /100 | #54 | Exceptional 5.1% |
| Chinese | 97.7 /100 | #55 | Exceptional 5.1% |
| Immigrants | Serbia | 97.4 /100 | #56 | Exceptional 5.1% |
| Immigrants | China | 97.2 /100 | #57 | Exceptional 5.1% |
| Asians | 97.2 /100 | #58 | Exceptional 5.1% |
| Swedes | 97.1 /100 | #59 | Exceptional 5.1% |
| Immigrants | Somalia | 97.1 /100 | #60 | Exceptional 5.1% |
| Indians (Asian) | 97.0 /100 | #61 | Exceptional 5.1% |
| Immigrants | France | 97.0 /100 | #62 | Exceptional 5.1% |