Canadian vs Immigrants from Hong Kong Unemployment Among Ages 30 to 34 years
COMPARE
Canadian
Immigrants from Hong Kong
Unemployment Among Ages 30 to 34 years
Unemployment Among Ages 30 to 34 years Comparison
Canadians
Immigrants from Hong Kong
5.5%
UNEMPLOYMENT AMONG AGES 30 TO 34 YEARS
38.2/ 100
METRIC RATING
186th/ 347
METRIC RANK
5.0%
UNEMPLOYMENT AMONG AGES 30 TO 34 YEARS
98.8/ 100
METRIC RATING
42nd/ 347
METRIC RANK
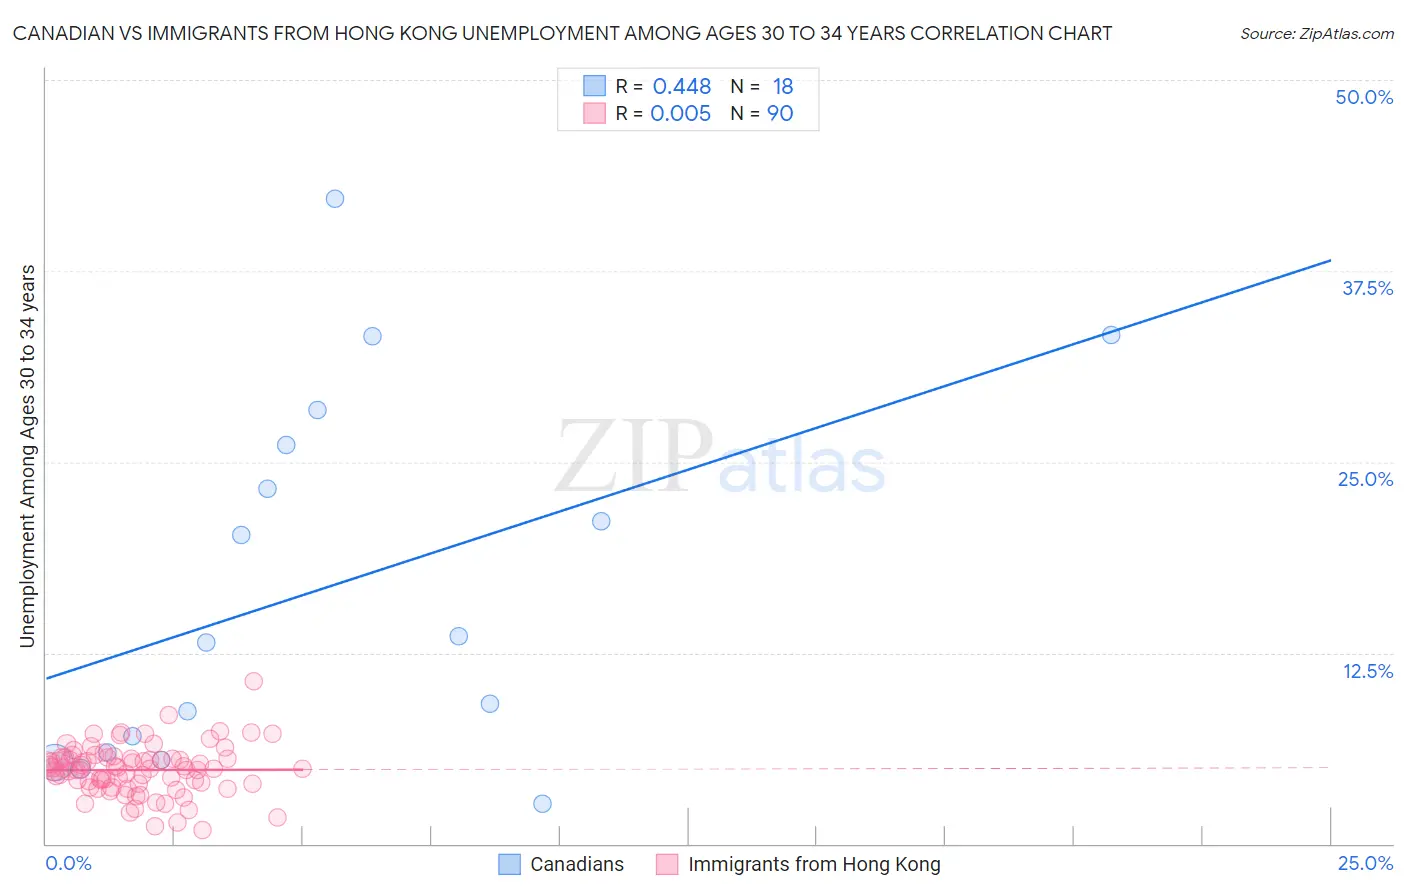
Canadian vs Immigrants from Hong Kong Unemployment Among Ages 30 to 34 years Correlation Chart
The statistical analysis conducted on geographies consisting of 404,101,488 people shows a moderate positive correlation between the proportion of Canadians and unemployment rate among population between the ages 30 and 34 in the United States with a correlation coefficient (R) of 0.448 and weighted average of 5.5%. Similarly, the statistical analysis conducted on geographies consisting of 245,493,498 people shows no correlation between the proportion of Immigrants from Hong Kong and unemployment rate among population between the ages 30 and 34 in the United States with a correlation coefficient (R) of 0.005 and weighted average of 5.0%, a difference of 9.2%.
Unemployment Among Ages 30 to 34 years Correlation Summary
| Measurement | Canadian | Immigrants from Hong Kong |
| Minimum | 2.6% | 0.90% |
| Maximum | 42.2% | 10.6% |
| Range | 39.6% | 9.7% |
| Mean | 16.9% | 4.8% |
| Median | 13.4% | 4.9% |
| Interquartile 25% (IQ1) | 6.0% | 4.0% |
| Interquartile 75% (IQ3) | 26.1% | 5.6% |
| Interquartile Range (IQR) | 20.2% | 1.6% |
| Standard Deviation (Sample) | 12.0% | 1.6% |
| Standard Deviation (Population) | 11.7% | 1.6% |
Similar Demographics by Unemployment Among Ages 30 to 34 years
Demographics Similar to Canadians by Unemployment Among Ages 30 to 34 years
In terms of unemployment among ages 30 to 34 years, the demographic groups most similar to Canadians are Immigrants from Western Asia (5.5%, a difference of 0.0%), Immigrants from Western Europe (5.5%, a difference of 0.070%), Immigrants from Norway (5.5%, a difference of 0.16%), Immigrants from England (5.5%, a difference of 0.19%), and Malaysian (5.5%, a difference of 0.25%).
| Demographics | Rating | Rank | Unemployment Among Ages 30 to 34 years |
| Costa Ricans | 46.7 /100 | #179 | Average 5.5% |
| Italians | 45.5 /100 | #180 | Average 5.5% |
| Immigrants | Lebanon | 43.5 /100 | #181 | Average 5.5% |
| Immigrants | Denmark | 43.4 /100 | #182 | Average 5.5% |
| Hungarians | 43.1 /100 | #183 | Average 5.5% |
| Malaysians | 41.8 /100 | #184 | Average 5.5% |
| Immigrants | Western Europe | 39.1 /100 | #185 | Fair 5.5% |
| Canadians | 38.2 /100 | #186 | Fair 5.5% |
| Immigrants | Western Asia | 38.2 /100 | #187 | Fair 5.5% |
| Immigrants | Norway | 36.1 /100 | #188 | Fair 5.5% |
| Immigrants | England | 35.7 /100 | #189 | Fair 5.5% |
| Immigrants | Kazakhstan | 33.9 /100 | #190 | Fair 5.5% |
| Irish | 31.3 /100 | #191 | Fair 5.5% |
| Moroccans | 31.2 /100 | #192 | Fair 5.5% |
| Immigrants | Africa | 31.0 /100 | #193 | Fair 5.5% |
Demographics Similar to Immigrants from Hong Kong by Unemployment Among Ages 30 to 34 years
In terms of unemployment among ages 30 to 34 years, the demographic groups most similar to Immigrants from Hong Kong are Soviet Union (5.0%, a difference of 0.10%), Immigrants from Vietnam (5.0%, a difference of 0.18%), Immigrants from Eastern Africa (5.0%, a difference of 0.18%), Immigrants from Belgium (5.1%, a difference of 0.25%), and Fijian (5.0%, a difference of 0.27%).
| Demographics | Rating | Rank | Unemployment Among Ages 30 to 34 years |
| Immigrants | Ethiopia | 99.2 /100 | #35 | Exceptional 5.0% |
| Czechs | 99.2 /100 | #36 | Exceptional 5.0% |
| Immigrants | Turkey | 99.0 /100 | #37 | Exceptional 5.0% |
| Sri Lankans | 99.0 /100 | #38 | Exceptional 5.0% |
| Fijians | 99.0 /100 | #39 | Exceptional 5.0% |
| Immigrants | Vietnam | 98.9 /100 | #40 | Exceptional 5.0% |
| Immigrants | Eastern Africa | 98.9 /100 | #41 | Exceptional 5.0% |
| Immigrants | Hong Kong | 98.8 /100 | #42 | Exceptional 5.0% |
| Soviet Union | 98.8 /100 | #43 | Exceptional 5.0% |
| Immigrants | Belgium | 98.7 /100 | #44 | Exceptional 5.1% |
| Yugoslavians | 98.6 /100 | #45 | Exceptional 5.1% |
| Immigrants | Congo | 98.4 /100 | #46 | Exceptional 5.1% |
| Cypriots | 98.4 /100 | #47 | Exceptional 5.1% |
| Assyrians/Chaldeans/Syriacs | 98.4 /100 | #48 | Exceptional 5.1% |
| Immigrants | Malaysia | 98.3 /100 | #49 | Exceptional 5.1% |