Immigrants from France vs Immigrants from Hong Kong Poverty
COMPARE
Immigrants from France
Immigrants from Hong Kong
Poverty
Poverty Comparison
Immigrants from France
Immigrants from Hong Kong
11.9%
POVERTY
80.5/ 100
METRIC RATING
141st/ 347
METRIC RANK
10.4%
POVERTY
99.8/ 100
METRIC RATING
13th/ 347
METRIC RANK
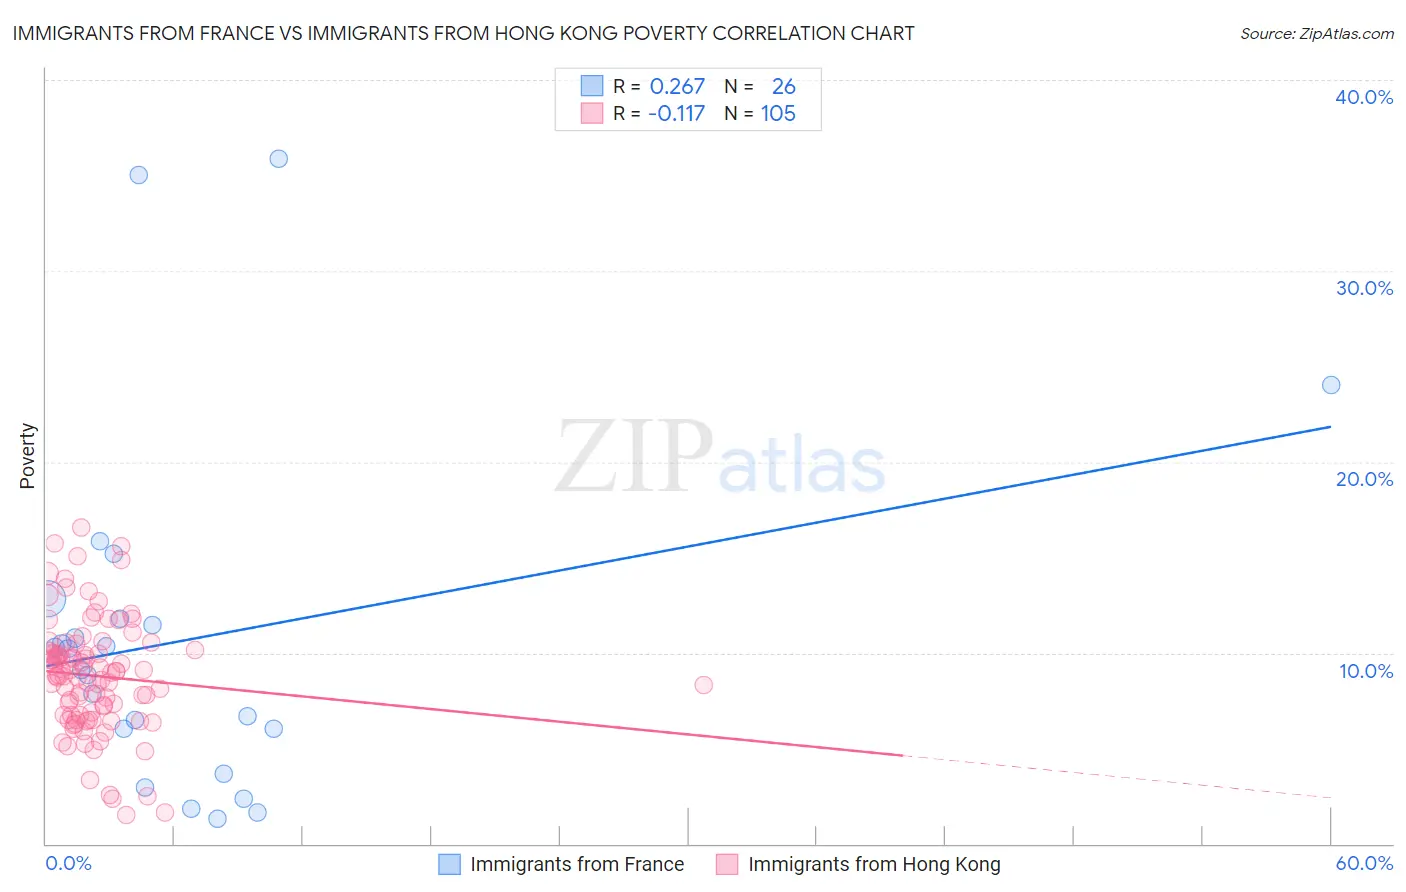
Immigrants from France vs Immigrants from Hong Kong Poverty Correlation Chart
The statistical analysis conducted on geographies consisting of 287,842,185 people shows a weak positive correlation between the proportion of Immigrants from France and poverty level in the United States with a correlation coefficient (R) of 0.267 and weighted average of 11.9%. Similarly, the statistical analysis conducted on geographies consisting of 253,892,762 people shows a poor negative correlation between the proportion of Immigrants from Hong Kong and poverty level in the United States with a correlation coefficient (R) of -0.117 and weighted average of 10.4%, a difference of 14.3%.
Poverty Correlation Summary
| Measurement | Immigrants from France | Immigrants from Hong Kong |
| Minimum | 1.3% | 1.5% |
| Maximum | 35.9% | 16.6% |
| Range | 34.6% | 15.1% |
| Mean | 10.7% | 8.8% |
| Median | 9.7% | 8.9% |
| Interquartile 25% (IQ1) | 6.0% | 6.7% |
| Interquartile 75% (IQ3) | 11.8% | 10.1% |
| Interquartile Range (IQR) | 5.8% | 3.4% |
| Standard Deviation (Sample) | 8.9% | 3.0% |
| Standard Deviation (Population) | 8.7% | 3.0% |
Similar Demographics by Poverty
Demographics Similar to Immigrants from France by Poverty
In terms of poverty, the demographic groups most similar to Immigrants from France are Basque (11.9%, a difference of 0.020%), Immigrants from Peru (11.9%, a difference of 0.090%), Brazilian (11.9%, a difference of 0.12%), Pakistani (11.9%, a difference of 0.28%), and Immigrants from Jordan (11.9%, a difference of 0.31%).
| Demographics | Rating | Rank | Poverty |
| Yugoslavians | 85.2 /100 | #134 | Excellent 11.8% |
| Immigrants | Vietnam | 85.2 /100 | #135 | Excellent 11.8% |
| Chileans | 84.2 /100 | #136 | Excellent 11.8% |
| Immigrants | Switzerland | 83.0 /100 | #137 | Excellent 11.8% |
| Immigrants | Jordan | 82.4 /100 | #138 | Excellent 11.9% |
| Pakistanis | 82.2 /100 | #139 | Excellent 11.9% |
| Immigrants | Peru | 81.1 /100 | #140 | Excellent 11.9% |
| Immigrants | France | 80.5 /100 | #141 | Excellent 11.9% |
| Basques | 80.4 /100 | #142 | Excellent 11.9% |
| Brazilians | 79.7 /100 | #143 | Good 11.9% |
| Icelanders | 77.9 /100 | #144 | Good 11.9% |
| Syrians | 75.1 /100 | #145 | Good 12.0% |
| Afghans | 74.9 /100 | #146 | Good 12.0% |
| Immigrants | Bosnia and Herzegovina | 73.7 /100 | #147 | Good 12.0% |
| Immigrants | Germany | 72.7 /100 | #148 | Good 12.0% |
Demographics Similar to Immigrants from Hong Kong by Poverty
In terms of poverty, the demographic groups most similar to Immigrants from Hong Kong are Bhutanese (10.4%, a difference of 0.22%), Immigrants from Bolivia (10.4%, a difference of 0.31%), Bolivian (10.4%, a difference of 0.32%), Immigrants from Lithuania (10.3%, a difference of 0.57%), and Lithuanian (10.5%, a difference of 0.62%).
| Demographics | Rating | Rank | Poverty |
| Assyrians/Chaldeans/Syriacs | 99.9 /100 | #6 | Exceptional 10.1% |
| Filipinos | 99.9 /100 | #7 | Exceptional 10.1% |
| Maltese | 99.9 /100 | #8 | Exceptional 10.2% |
| Immigrants | South Central Asia | 99.9 /100 | #9 | Exceptional 10.2% |
| Bulgarians | 99.9 /100 | #10 | Exceptional 10.2% |
| Immigrants | Lithuania | 99.9 /100 | #11 | Exceptional 10.3% |
| Bhutanese | 99.8 /100 | #12 | Exceptional 10.4% |
| Immigrants | Hong Kong | 99.8 /100 | #13 | Exceptional 10.4% |
| Immigrants | Bolivia | 99.8 /100 | #14 | Exceptional 10.4% |
| Bolivians | 99.8 /100 | #15 | Exceptional 10.4% |
| Lithuanians | 99.8 /100 | #16 | Exceptional 10.5% |
| Norwegians | 99.8 /100 | #17 | Exceptional 10.5% |
| Latvians | 99.8 /100 | #18 | Exceptional 10.5% |
| Immigrants | Scotland | 99.7 /100 | #19 | Exceptional 10.6% |
| Immigrants | North Macedonia | 99.7 /100 | #20 | Exceptional 10.6% |