Immigrants from England vs Cape Verdean Unemployment Among Women with Children Ages 6 to 17 years
COMPARE
Immigrants from England
Cape Verdean
Unemployment Among Women with Children Ages 6 to 17 years
Unemployment Among Women with Children Ages 6 to 17 years Comparison
Immigrants from England
Cape Verdeans
8.9%
UNEMPLOYMENT AMONG WOMEN WITH CHILDREN AGES 6 TO 17 YEARS
57.7/ 100
METRIC RATING
167th/ 347
METRIC RANK
10.9%
UNEMPLOYMENT AMONG WOMEN WITH CHILDREN AGES 6 TO 17 YEARS
0.0/ 100
METRIC RATING
327th/ 347
METRIC RANK
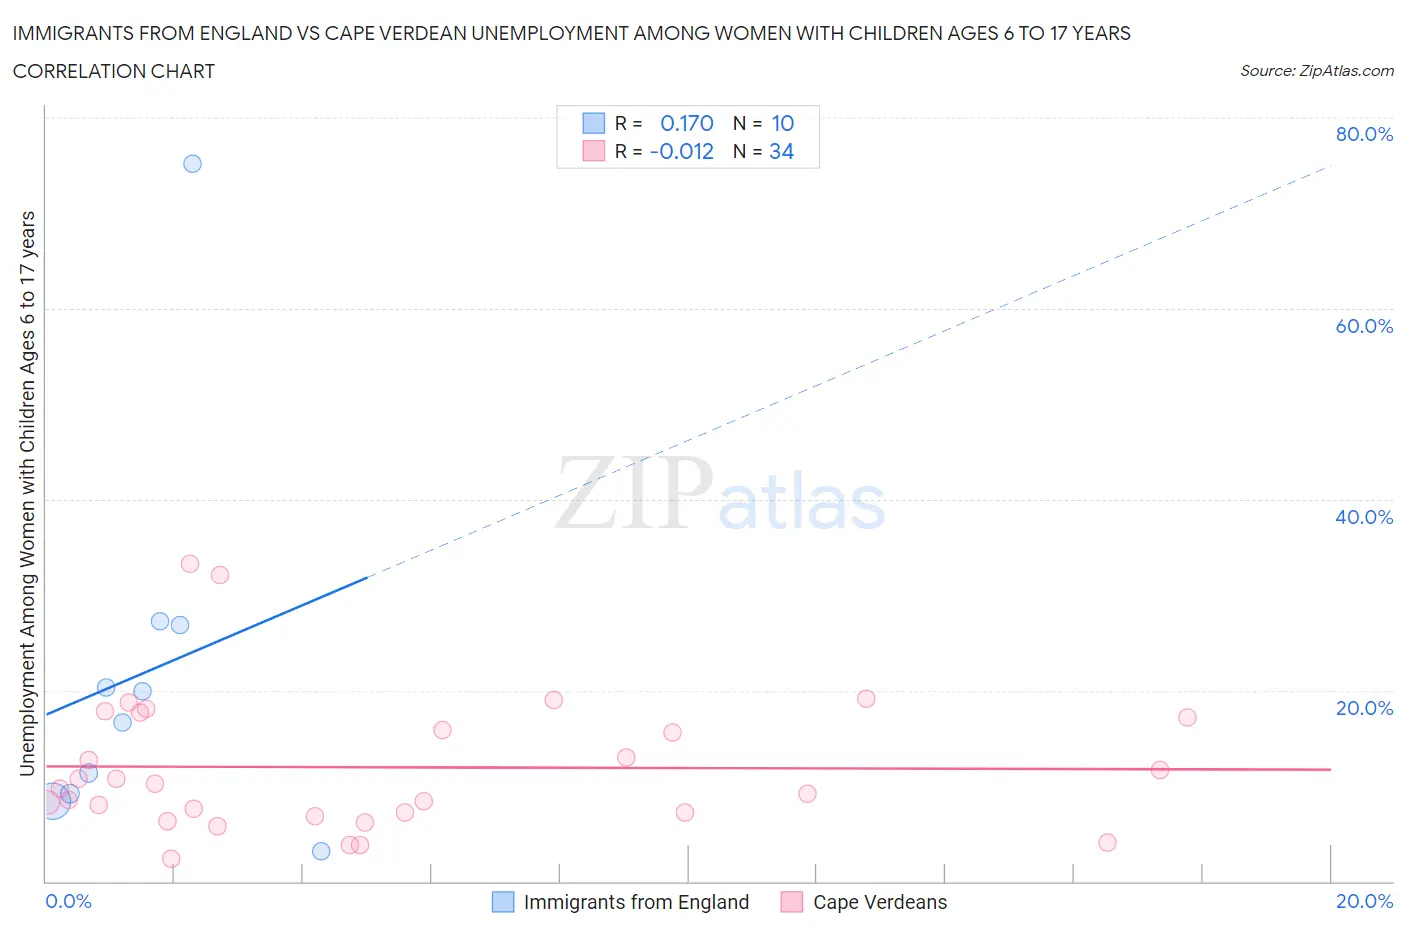
Immigrants from England vs Cape Verdean Unemployment Among Women with Children Ages 6 to 17 years Correlation Chart
The statistical analysis conducted on geographies consisting of 278,323,272 people shows a poor positive correlation between the proportion of Immigrants from England and unemployment rate among women with children between the ages 6 and 17 in the United States with a correlation coefficient (R) of 0.170 and weighted average of 8.9%. Similarly, the statistical analysis conducted on geographies consisting of 93,873,663 people shows no correlation between the proportion of Cape Verdeans and unemployment rate among women with children between the ages 6 and 17 in the United States with a correlation coefficient (R) of -0.012 and weighted average of 10.9%, a difference of 21.5%.
Unemployment Among Women with Children Ages 6 to 17 years Correlation Summary
| Measurement | Immigrants from England | Cape Verdean |
| Minimum | 3.1% | 2.4% |
| Maximum | 75.1% | 33.3% |
| Range | 72.0% | 30.9% |
| Mean | 21.8% | 11.9% |
| Median | 18.3% | 10.0% |
| Interquartile 25% (IQ1) | 9.2% | 7.2% |
| Interquartile 75% (IQ3) | 26.8% | 17.2% |
| Interquartile Range (IQR) | 17.7% | 10.0% |
| Standard Deviation (Sample) | 20.4% | 7.2% |
| Standard Deviation (Population) | 19.3% | 7.1% |
Similar Demographics by Unemployment Among Women with Children Ages 6 to 17 years
Demographics Similar to Immigrants from England by Unemployment Among Women with Children Ages 6 to 17 years
In terms of unemployment among women with children ages 6 to 17 years, the demographic groups most similar to Immigrants from England are Moroccan (8.9%, a difference of 0.030%), Immigrants from Croatia (8.9%, a difference of 0.030%), Immigrants from Micronesia (8.9%, a difference of 0.070%), Ukrainian (8.9%, a difference of 0.090%), and British (8.9%, a difference of 0.11%).
| Demographics | Rating | Rank | Unemployment Among Women with Children Ages 6 to 17 years |
| Immigrants | Hungary | 63.4 /100 | #160 | Good 8.9% |
| Immigrants | Guyana | 63.0 /100 | #161 | Good 8.9% |
| Immigrants | Netherlands | 60.8 /100 | #162 | Good 8.9% |
| Mexican American Indians | 60.6 /100 | #163 | Good 8.9% |
| Ukrainians | 59.7 /100 | #164 | Average 8.9% |
| Immigrants | Micronesia | 59.2 /100 | #165 | Average 8.9% |
| Moroccans | 58.3 /100 | #166 | Average 8.9% |
| Immigrants | England | 57.7 /100 | #167 | Average 8.9% |
| Immigrants | Croatia | 57.1 /100 | #168 | Average 8.9% |
| British | 55.2 /100 | #169 | Average 8.9% |
| Turks | 54.1 /100 | #170 | Average 8.9% |
| Jordanians | 52.2 /100 | #171 | Average 9.0% |
| Immigrants | West Indies | 52.2 /100 | #172 | Average 9.0% |
| Immigrants | Brazil | 51.0 /100 | #173 | Average 9.0% |
| Immigrants | Costa Rica | 50.0 /100 | #174 | Average 9.0% |
Demographics Similar to Cape Verdeans by Unemployment Among Women with Children Ages 6 to 17 years
In terms of unemployment among women with children ages 6 to 17 years, the demographic groups most similar to Cape Verdeans are Liberian (10.8%, a difference of 0.070%), Cajun (10.8%, a difference of 0.13%), Ottawa (10.9%, a difference of 0.14%), Immigrants from Dominican Republic (10.8%, a difference of 0.32%), and Dominican (10.8%, a difference of 0.38%).
| Demographics | Rating | Rank | Unemployment Among Women with Children Ages 6 to 17 years |
| Apache | 0.0 /100 | #320 | Tragic 10.7% |
| Tohono O'odham | 0.0 /100 | #321 | Tragic 10.7% |
| Cree | 0.0 /100 | #322 | Tragic 10.8% |
| Dominicans | 0.0 /100 | #323 | Tragic 10.8% |
| Immigrants | Dominican Republic | 0.0 /100 | #324 | Tragic 10.8% |
| Cajuns | 0.0 /100 | #325 | Tragic 10.8% |
| Liberians | 0.0 /100 | #326 | Tragic 10.8% |
| Cape Verdeans | 0.0 /100 | #327 | Tragic 10.9% |
| Ottawa | 0.0 /100 | #328 | Tragic 10.9% |
| Pennsylvania Germans | 0.0 /100 | #329 | Tragic 11.0% |
| Chippewa | 0.0 /100 | #330 | Tragic 11.1% |
| Blacks/African Americans | 0.0 /100 | #331 | Tragic 11.4% |
| Tsimshian | 0.0 /100 | #332 | Tragic 11.4% |
| Natives/Alaskans | 0.0 /100 | #333 | Tragic 11.5% |
| Ugandans | 0.0 /100 | #334 | Tragic 12.0% |