Immigrants from El Salvador vs Immigrants from Western Africa Unemployment Among Ages 35 to 44 years
COMPARE
Immigrants from El Salvador
Immigrants from Western Africa
Unemployment Among Ages 35 to 44 years
Unemployment Among Ages 35 to 44 years Comparison
Immigrants from El Salvador
Immigrants from Western Africa
5.2%
UNEMPLOYMENT AMONG AGES 35 TO 44 YEARS
0.2/ 100
METRIC RATING
250th/ 347
METRIC RANK
5.3%
UNEMPLOYMENT AMONG AGES 35 TO 44 YEARS
0.0/ 100
METRIC RATING
267th/ 347
METRIC RANK
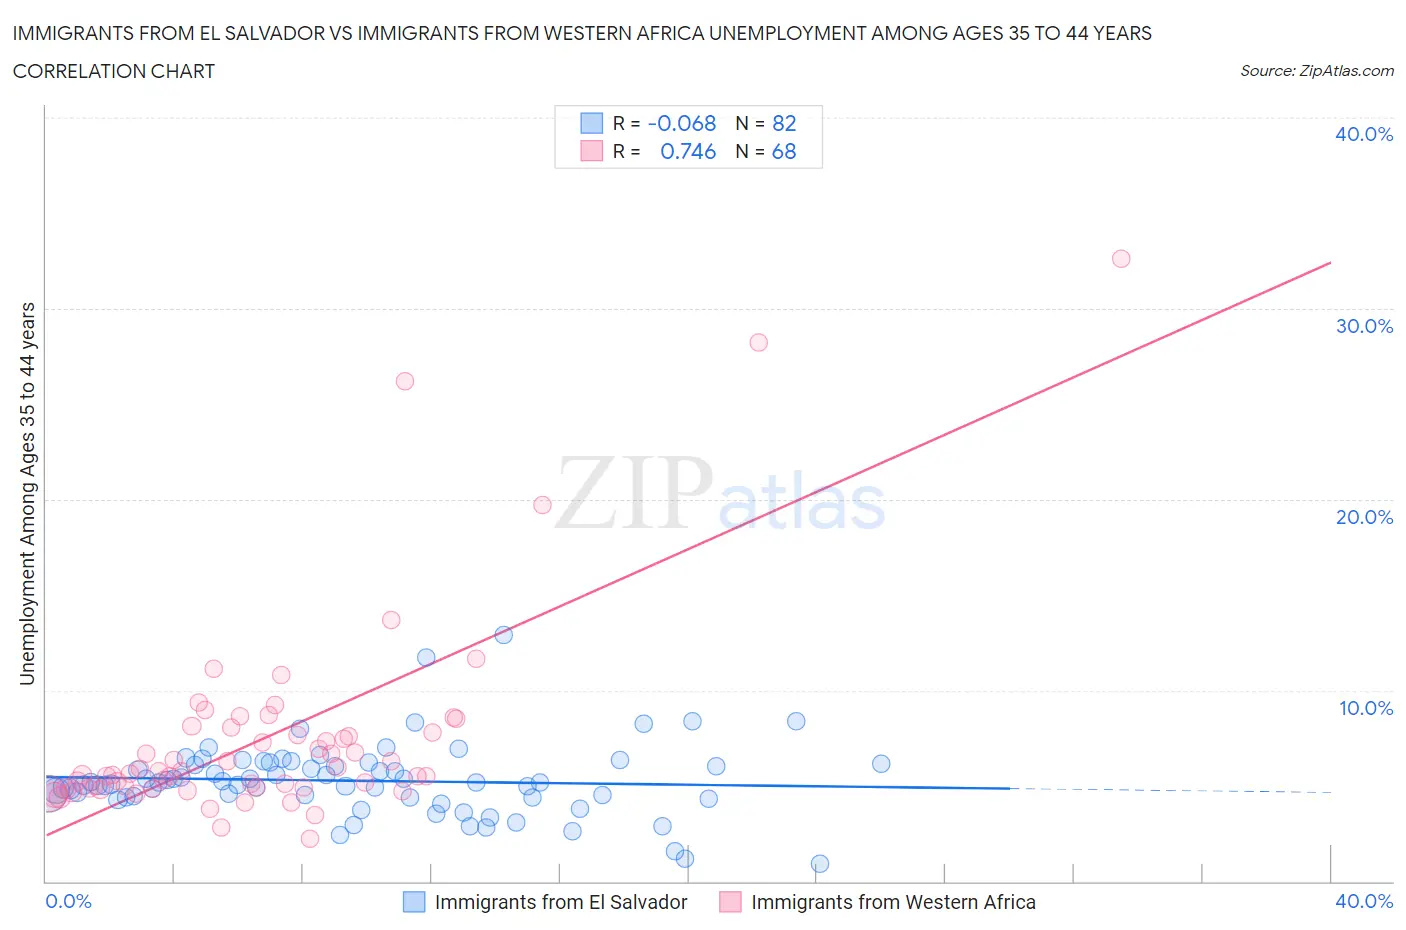
Immigrants from El Salvador vs Immigrants from Western Africa Unemployment Among Ages 35 to 44 years Correlation Chart
The statistical analysis conducted on geographies consisting of 352,048,147 people shows a slight negative correlation between the proportion of Immigrants from El Salvador and unemployment rate among population between the ages 35 and 44 in the United States with a correlation coefficient (R) of -0.068 and weighted average of 5.2%. Similarly, the statistical analysis conducted on geographies consisting of 352,162,514 people shows a strong positive correlation between the proportion of Immigrants from Western Africa and unemployment rate among population between the ages 35 and 44 in the United States with a correlation coefficient (R) of 0.746 and weighted average of 5.3%, a difference of 2.6%.
Unemployment Among Ages 35 to 44 years Correlation Summary
| Measurement | Immigrants from El Salvador | Immigrants from Western Africa |
| Minimum | 0.90% | 2.2% |
| Maximum | 12.9% | 32.6% |
| Range | 12.0% | 30.4% |
| Mean | 5.3% | 7.5% |
| Median | 5.2% | 5.7% |
| Interquartile 25% (IQ1) | 4.4% | 4.9% |
| Interquartile 75% (IQ3) | 6.1% | 7.9% |
| Interquartile Range (IQR) | 1.7% | 3.1% |
| Standard Deviation (Sample) | 1.9% | 5.4% |
| Standard Deviation (Population) | 1.9% | 5.3% |
Demographics Similar to Immigrants from El Salvador and Immigrants from Western Africa by Unemployment Among Ages 35 to 44 years
In terms of unemployment among ages 35 to 44 years, the demographic groups most similar to Immigrants from El Salvador are Immigrants from Liberia (5.2%, a difference of 0.040%), Alsatian (5.2%, a difference of 0.060%), Comanche (5.2%, a difference of 0.44%), Armenian (5.2%, a difference of 0.57%), and Mexican American Indian (5.2%, a difference of 0.59%). Similarly, the demographic groups most similar to Immigrants from Western Africa are Hawaiian (5.3%, a difference of 0.080%), Immigrants from Bangladesh (5.3%, a difference of 0.13%), Yaqui (5.3%, a difference of 0.14%), Choctaw (5.3%, a difference of 0.34%), and Ghanaian (5.3%, a difference of 0.34%).
| Demographics | Rating | Rank | Unemployment Among Ages 35 to 44 years |
| Alsatians | 0.2 /100 | #248 | Tragic 5.2% |
| Immigrants | Liberia | 0.2 /100 | #249 | Tragic 5.2% |
| Immigrants | El Salvador | 0.2 /100 | #250 | Tragic 5.2% |
| Comanche | 0.2 /100 | #251 | Tragic 5.2% |
| Armenians | 0.2 /100 | #252 | Tragic 5.2% |
| Mexican American Indians | 0.2 /100 | #253 | Tragic 5.2% |
| Immigrants | Bahamas | 0.2 /100 | #254 | Tragic 5.2% |
| Cherokee | 0.2 /100 | #255 | Tragic 5.2% |
| Seminole | 0.1 /100 | #256 | Tragic 5.2% |
| Immigrants | Fiji | 0.1 /100 | #257 | Tragic 5.3% |
| Immigrants | Latin America | 0.1 /100 | #258 | Tragic 5.3% |
| Mexicans | 0.1 /100 | #259 | Tragic 5.3% |
| Sub-Saharan Africans | 0.1 /100 | #260 | Tragic 5.3% |
| Spanish Americans | 0.1 /100 | #261 | Tragic 5.3% |
| Immigrants | Central America | 0.1 /100 | #262 | Tragic 5.3% |
| Choctaw | 0.1 /100 | #263 | Tragic 5.3% |
| Ghanaians | 0.1 /100 | #264 | Tragic 5.3% |
| Yaqui | 0.1 /100 | #265 | Tragic 5.3% |
| Immigrants | Bangladesh | 0.1 /100 | #266 | Tragic 5.3% |
| Immigrants | Western Africa | 0.0 /100 | #267 | Tragic 5.3% |
| Hawaiians | 0.0 /100 | #268 | Tragic 5.3% |