Immigrants from Ecuador vs Syrian Unemployment Among Ages 25 to 29 years
COMPARE
Immigrants from Ecuador
Syrian
Unemployment Among Ages 25 to 29 years
Unemployment Among Ages 25 to 29 years Comparison
Immigrants from Ecuador
Syrians
7.4%
UNEMPLOYMENT AMONG AGES 25 TO 29 YEARS
0.1/ 100
METRIC RATING
268th/ 347
METRIC RANK
6.5%
UNEMPLOYMENT AMONG AGES 25 TO 29 YEARS
82.1/ 100
METRIC RATING
125th/ 347
METRIC RANK
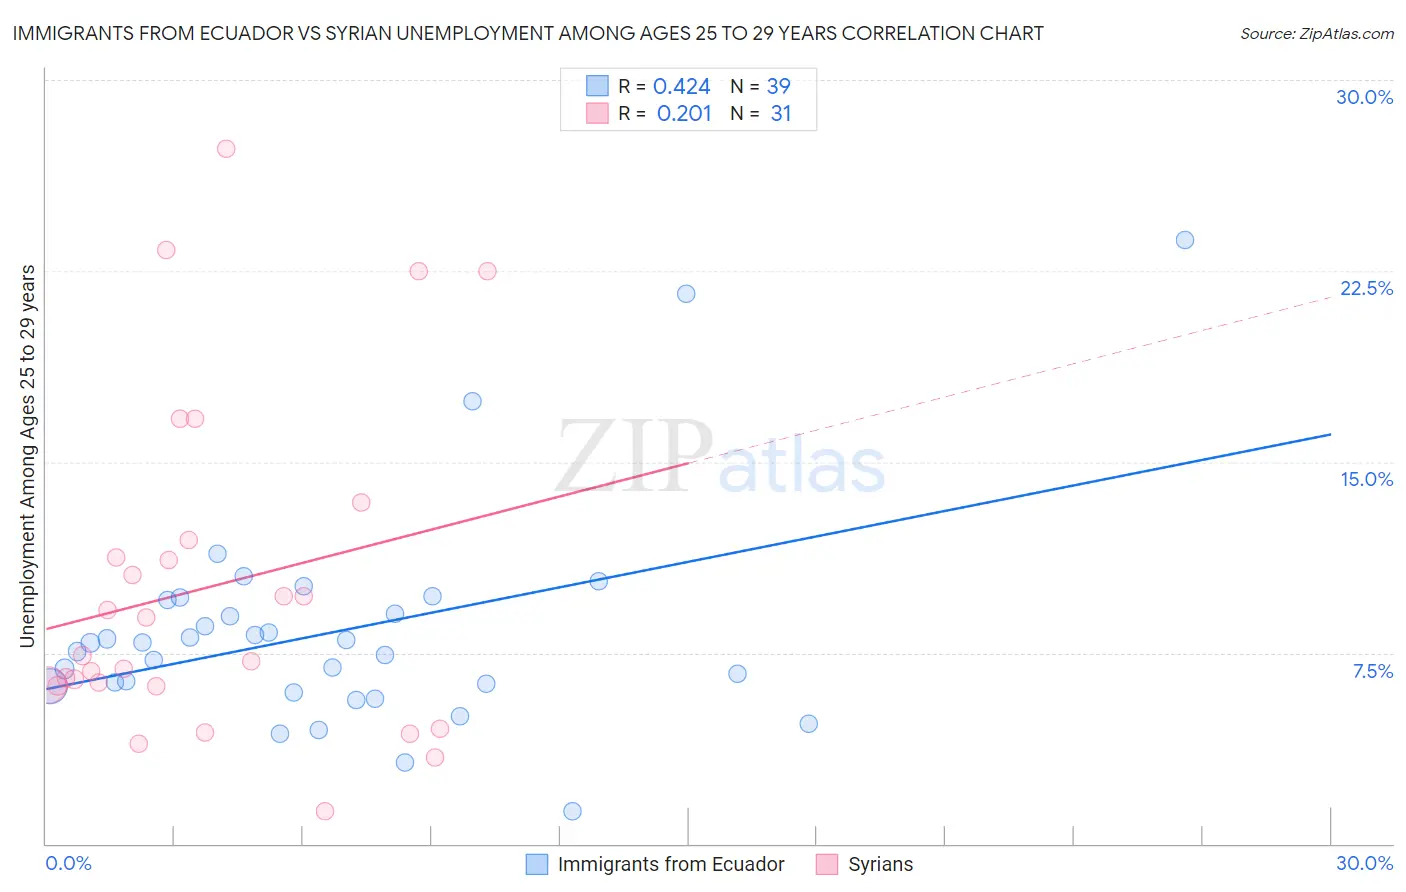
Immigrants from Ecuador vs Syrian Unemployment Among Ages 25 to 29 years Correlation Chart
The statistical analysis conducted on geographies consisting of 263,330,571 people shows a moderate positive correlation between the proportion of Immigrants from Ecuador and unemployment rate among population between the ages 25 and 29 in the United States with a correlation coefficient (R) of 0.424 and weighted average of 7.4%. Similarly, the statistical analysis conducted on geographies consisting of 256,736,419 people shows a weak positive correlation between the proportion of Syrians and unemployment rate among population between the ages 25 and 29 in the United States with a correlation coefficient (R) of 0.201 and weighted average of 6.5%, a difference of 14.2%.
Unemployment Among Ages 25 to 29 years Correlation Summary
| Measurement | Immigrants from Ecuador | Syrian |
| Minimum | 1.3% | 1.3% |
| Maximum | 23.7% | 27.3% |
| Range | 22.4% | 26.0% |
| Mean | 8.3% | 10.1% |
| Median | 7.9% | 7.4% |
| Interquartile 25% (IQ1) | 6.2% | 6.2% |
| Interquartile 75% (IQ3) | 9.6% | 11.9% |
| Interquartile Range (IQR) | 3.4% | 5.7% |
| Standard Deviation (Sample) | 4.3% | 6.5% |
| Standard Deviation (Population) | 4.2% | 6.4% |
Similar Demographics by Unemployment Among Ages 25 to 29 years
Demographics Similar to Immigrants from Ecuador by Unemployment Among Ages 25 to 29 years
In terms of unemployment among ages 25 to 29 years, the demographic groups most similar to Immigrants from Ecuador are Pennsylvania German (7.4%, a difference of 0.020%), Immigrants from Latin America (7.4%, a difference of 0.060%), Paiute (7.4%, a difference of 0.090%), Immigrants from Fiji (7.4%, a difference of 0.23%), and Immigrants from Western Africa (7.4%, a difference of 0.29%).
| Demographics | Rating | Rank | Unemployment Among Ages 25 to 29 years |
| Nigerians | 0.1 /100 | #261 | Tragic 7.4% |
| Ecuadorians | 0.1 /100 | #262 | Tragic 7.4% |
| Kiowa | 0.1 /100 | #263 | Tragic 7.4% |
| Immigrants | Western Africa | 0.1 /100 | #264 | Tragic 7.4% |
| Immigrants | Fiji | 0.1 /100 | #265 | Tragic 7.4% |
| Paiute | 0.1 /100 | #266 | Tragic 7.4% |
| Pennsylvania Germans | 0.1 /100 | #267 | Tragic 7.4% |
| Immigrants | Ecuador | 0.1 /100 | #268 | Tragic 7.4% |
| Immigrants | Latin America | 0.1 /100 | #269 | Tragic 7.4% |
| Bahamians | 0.0 /100 | #270 | Tragic 7.5% |
| Choctaw | 0.0 /100 | #271 | Tragic 7.5% |
| Immigrants | Bahamas | 0.0 /100 | #272 | Tragic 7.5% |
| Immigrants | Nigeria | 0.0 /100 | #273 | Tragic 7.5% |
| Immigrants | Central America | 0.0 /100 | #274 | Tragic 7.5% |
| Immigrants | Ghana | 0.0 /100 | #275 | Tragic 7.5% |
Demographics Similar to Syrians by Unemployment Among Ages 25 to 29 years
In terms of unemployment among ages 25 to 29 years, the demographic groups most similar to Syrians are Brazilian (6.5%, a difference of 0.020%), Arab (6.5%, a difference of 0.040%), Dutch (6.5%, a difference of 0.15%), Laotian (6.5%, a difference of 0.16%), and Immigrants from Chile (6.5%, a difference of 0.17%).
| Demographics | Rating | Rank | Unemployment Among Ages 25 to 29 years |
| Chileans | 85.3 /100 | #118 | Excellent 6.5% |
| Immigrants | South Africa | 84.9 /100 | #119 | Excellent 6.5% |
| Immigrants | Moldova | 84.5 /100 | #120 | Excellent 6.5% |
| Immigrants | Uganda | 84.5 /100 | #121 | Excellent 6.5% |
| Immigrants | Belarus | 83.7 /100 | #122 | Excellent 6.5% |
| Laotians | 83.6 /100 | #123 | Excellent 6.5% |
| Arabs | 82.5 /100 | #124 | Excellent 6.5% |
| Syrians | 82.1 /100 | #125 | Excellent 6.5% |
| Brazilians | 81.9 /100 | #126 | Excellent 6.5% |
| Dutch | 80.6 /100 | #127 | Excellent 6.5% |
| Immigrants | Chile | 80.5 /100 | #128 | Excellent 6.5% |
| Sri Lankans | 80.3 /100 | #129 | Excellent 6.5% |
| Immigrants | Peru | 79.9 /100 | #130 | Good 6.5% |
| Immigrants | Afghanistan | 79.2 /100 | #131 | Good 6.5% |
| Poles | 76.6 /100 | #132 | Good 6.5% |