Immigrants from Ecuador vs Syrian 4th Grade
COMPARE
Immigrants from Ecuador
Syrian
4th Grade
4th Grade Comparison
Immigrants from Ecuador
Syrians
96.2%
4TH GRADE
0.0/ 100
METRIC RATING
316th/ 347
METRIC RANK
97.8%
4TH GRADE
94.9/ 100
METRIC RATING
117th/ 347
METRIC RANK
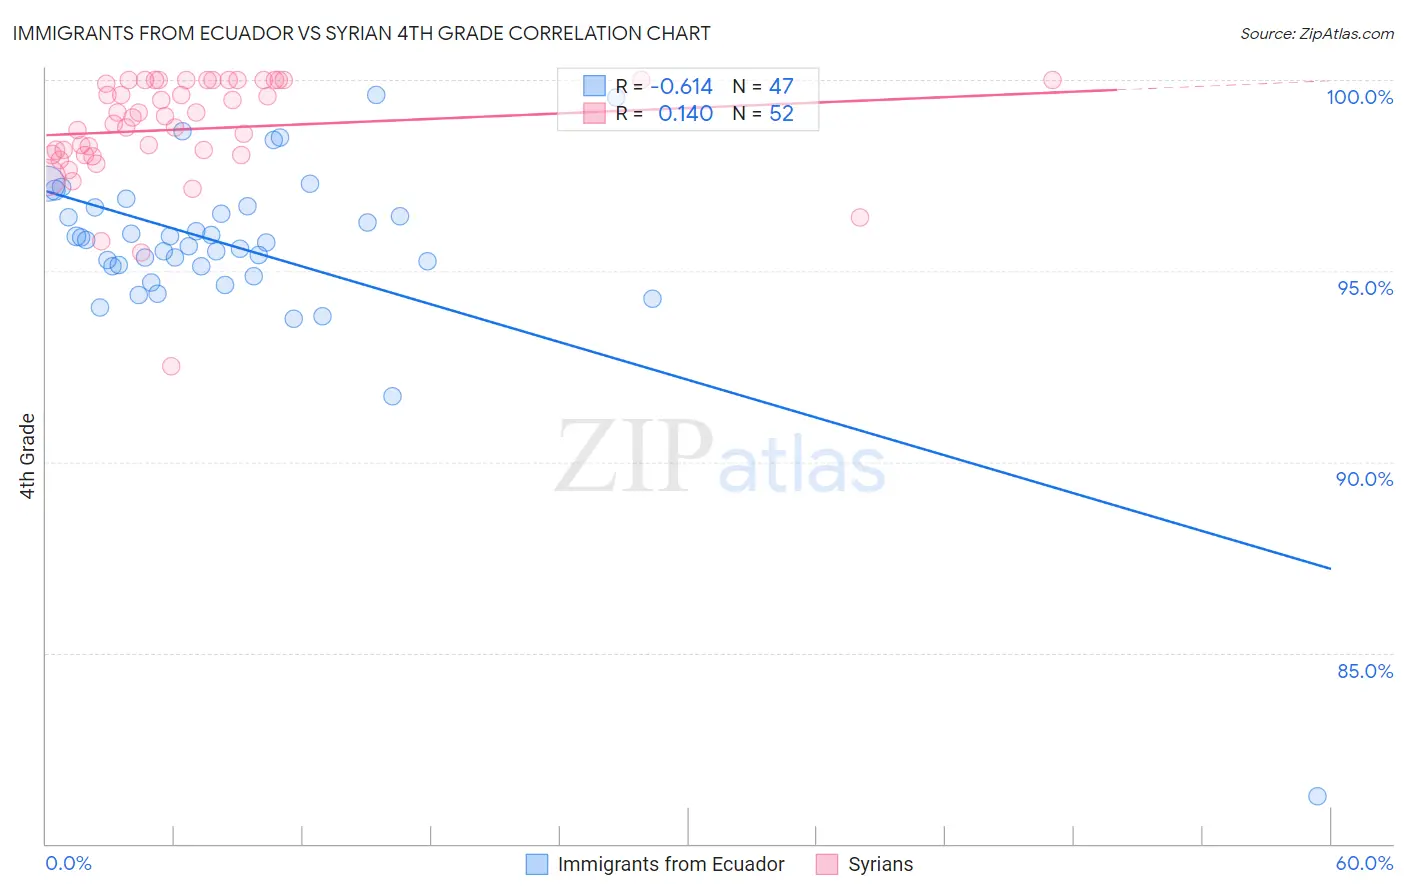
Immigrants from Ecuador vs Syrian 4th Grade Correlation Chart
The statistical analysis conducted on geographies consisting of 271,020,679 people shows a significant negative correlation between the proportion of Immigrants from Ecuador and percentage of population with at least 4th grade education in the United States with a correlation coefficient (R) of -0.614 and weighted average of 96.2%. Similarly, the statistical analysis conducted on geographies consisting of 266,305,988 people shows a poor positive correlation between the proportion of Syrians and percentage of population with at least 4th grade education in the United States with a correlation coefficient (R) of 0.140 and weighted average of 97.8%, a difference of 1.6%.
4th Grade Correlation Summary
| Measurement | Immigrants from Ecuador | Syrian |
| Minimum | 81.2% | 92.5% |
| Maximum | 99.6% | 100.0% |
| Range | 18.3% | 7.5% |
| Mean | 95.6% | 98.7% |
| Median | 95.8% | 99.0% |
| Interquartile 25% (IQ1) | 95.1% | 98.0% |
| Interquartile 75% (IQ3) | 96.7% | 100.0% |
| Interquartile Range (IQR) | 1.6% | 2.0% |
| Standard Deviation (Sample) | 2.6% | 1.4% |
| Standard Deviation (Population) | 2.6% | 1.4% |
Similar Demographics by 4th Grade
Demographics Similar to Immigrants from Ecuador by 4th Grade
In terms of 4th grade, the demographic groups most similar to Immigrants from Ecuador are Indonesian (96.2%, a difference of 0.010%), Vietnamese (96.2%, a difference of 0.010%), Nicaraguan (96.2%, a difference of 0.010%), Cape Verdean (96.2%, a difference of 0.030%), and Immigrants from Bangladesh (96.2%, a difference of 0.040%).
| Demographics | Rating | Rank | 4th Grade |
| Immigrants | Guyana | 0.0 /100 | #309 | Tragic 96.3% |
| Immigrants | Burma/Myanmar | 0.0 /100 | #310 | Tragic 96.3% |
| Immigrants | Bangladesh | 0.0 /100 | #311 | Tragic 96.2% |
| Cape Verdeans | 0.0 /100 | #312 | Tragic 96.2% |
| Indonesians | 0.0 /100 | #313 | Tragic 96.2% |
| Vietnamese | 0.0 /100 | #314 | Tragic 96.2% |
| Nicaraguans | 0.0 /100 | #315 | Tragic 96.2% |
| Immigrants | Ecuador | 0.0 /100 | #316 | Tragic 96.2% |
| Central American Indians | 0.0 /100 | #317 | Tragic 96.2% |
| Immigrants | Azores | 0.0 /100 | #318 | Tragic 96.1% |
| Belizeans | 0.0 /100 | #319 | Tragic 96.1% |
| Bangladeshis | 0.0 /100 | #320 | Tragic 96.1% |
| Japanese | 0.0 /100 | #321 | Tragic 96.0% |
| Immigrants | Vietnam | 0.0 /100 | #322 | Tragic 96.0% |
| Immigrants | Nicaragua | 0.0 /100 | #323 | Tragic 96.0% |
Demographics Similar to Syrians by 4th Grade
In terms of 4th grade, the demographic groups most similar to Syrians are Menominee (97.8%, a difference of 0.0%), Immigrants from Saudi Arabia (97.8%, a difference of 0.0%), Immigrants from France (97.8%, a difference of 0.0%), Iroquois (97.8%, a difference of 0.010%), and Lebanese (97.8%, a difference of 0.010%).
| Demographics | Rating | Rank | 4th Grade |
| Thais | 96.7 /100 | #110 | Exceptional 97.8% |
| Immigrants | Switzerland | 96.1 /100 | #111 | Exceptional 97.8% |
| Okinawans | 96.0 /100 | #112 | Exceptional 97.8% |
| Basques | 95.8 /100 | #113 | Exceptional 97.8% |
| Iroquois | 95.4 /100 | #114 | Exceptional 97.8% |
| Lebanese | 95.4 /100 | #115 | Exceptional 97.8% |
| Immigrants | Croatia | 95.2 /100 | #116 | Exceptional 97.8% |
| Syrians | 94.9 /100 | #117 | Exceptional 97.8% |
| Menominee | 94.9 /100 | #118 | Exceptional 97.8% |
| Immigrants | Saudi Arabia | 94.8 /100 | #119 | Exceptional 97.8% |
| Immigrants | France | 94.8 /100 | #120 | Exceptional 97.8% |
| Immigrants | Norway | 94.2 /100 | #121 | Exceptional 97.8% |
| Immigrants | Japan | 94.1 /100 | #122 | Exceptional 97.8% |
| Immigrants | Zimbabwe | 93.9 /100 | #123 | Exceptional 97.8% |
| Spanish | 93.7 /100 | #124 | Exceptional 97.8% |