Immigrants from Ecuador vs Barbadian Unemployment Among Ages 25 to 29 years
COMPARE
Immigrants from Ecuador
Barbadian
Unemployment Among Ages 25 to 29 years
Unemployment Among Ages 25 to 29 years Comparison
Immigrants from Ecuador
Barbadians
7.4%
UNEMPLOYMENT AMONG AGES 25 TO 29 YEARS
0.1/ 100
METRIC RATING
268th/ 347
METRIC RANK
7.9%
UNEMPLOYMENT AMONG AGES 25 TO 29 YEARS
0.0/ 100
METRIC RATING
299th/ 347
METRIC RANK
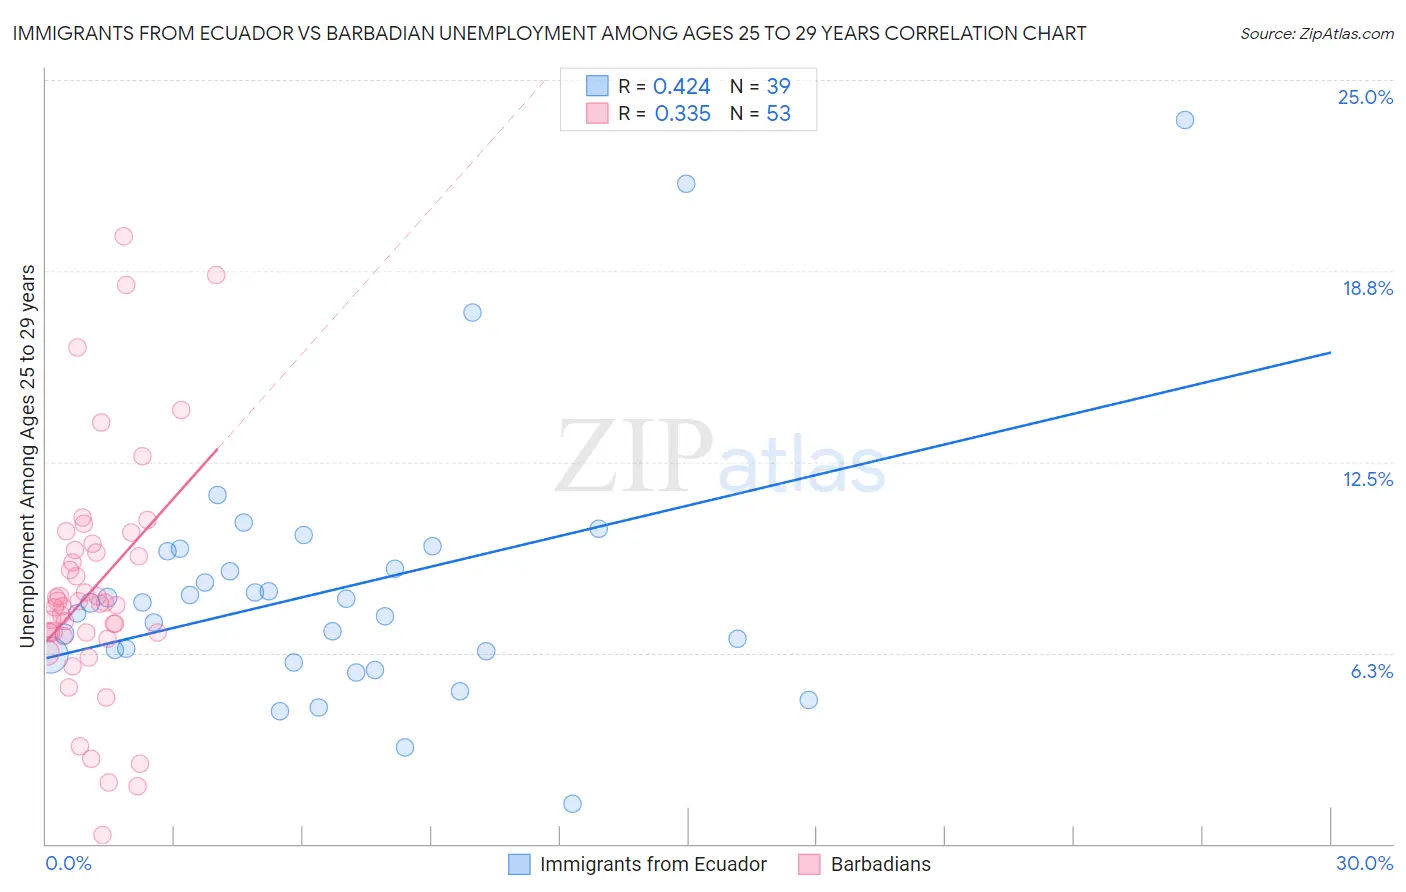
Immigrants from Ecuador vs Barbadian Unemployment Among Ages 25 to 29 years Correlation Chart
The statistical analysis conducted on geographies consisting of 263,330,571 people shows a moderate positive correlation between the proportion of Immigrants from Ecuador and unemployment rate among population between the ages 25 and 29 in the United States with a correlation coefficient (R) of 0.424 and weighted average of 7.4%. Similarly, the statistical analysis conducted on geographies consisting of 139,275,907 people shows a mild positive correlation between the proportion of Barbadians and unemployment rate among population between the ages 25 and 29 in the United States with a correlation coefficient (R) of 0.335 and weighted average of 7.9%, a difference of 6.6%.
Unemployment Among Ages 25 to 29 years Correlation Summary
| Measurement | Immigrants from Ecuador | Barbadian |
| Minimum | 1.3% | 0.30% |
| Maximum | 23.7% | 19.9% |
| Range | 22.4% | 19.6% |
| Mean | 8.3% | 8.4% |
| Median | 7.9% | 7.9% |
| Interquartile 25% (IQ1) | 6.2% | 6.8% |
| Interquartile 75% (IQ3) | 9.6% | 9.7% |
| Interquartile Range (IQR) | 3.4% | 2.9% |
| Standard Deviation (Sample) | 4.3% | 3.9% |
| Standard Deviation (Population) | 4.2% | 3.9% |
Similar Demographics by Unemployment Among Ages 25 to 29 years
Demographics Similar to Immigrants from Ecuador by Unemployment Among Ages 25 to 29 years
In terms of unemployment among ages 25 to 29 years, the demographic groups most similar to Immigrants from Ecuador are Pennsylvania German (7.4%, a difference of 0.020%), Immigrants from Latin America (7.4%, a difference of 0.060%), Paiute (7.4%, a difference of 0.090%), Immigrants from Fiji (7.4%, a difference of 0.23%), and Immigrants from Western Africa (7.4%, a difference of 0.29%).
| Demographics | Rating | Rank | Unemployment Among Ages 25 to 29 years |
| Nigerians | 0.1 /100 | #261 | Tragic 7.4% |
| Ecuadorians | 0.1 /100 | #262 | Tragic 7.4% |
| Kiowa | 0.1 /100 | #263 | Tragic 7.4% |
| Immigrants | Western Africa | 0.1 /100 | #264 | Tragic 7.4% |
| Immigrants | Fiji | 0.1 /100 | #265 | Tragic 7.4% |
| Paiute | 0.1 /100 | #266 | Tragic 7.4% |
| Pennsylvania Germans | 0.1 /100 | #267 | Tragic 7.4% |
| Immigrants | Ecuador | 0.1 /100 | #268 | Tragic 7.4% |
| Immigrants | Latin America | 0.1 /100 | #269 | Tragic 7.4% |
| Bahamians | 0.0 /100 | #270 | Tragic 7.5% |
| Choctaw | 0.0 /100 | #271 | Tragic 7.5% |
| Immigrants | Bahamas | 0.0 /100 | #272 | Tragic 7.5% |
| Immigrants | Nigeria | 0.0 /100 | #273 | Tragic 7.5% |
| Immigrants | Central America | 0.0 /100 | #274 | Tragic 7.5% |
| Immigrants | Ghana | 0.0 /100 | #275 | Tragic 7.5% |
Demographics Similar to Barbadians by Unemployment Among Ages 25 to 29 years
In terms of unemployment among ages 25 to 29 years, the demographic groups most similar to Barbadians are Central American Indian (7.9%, a difference of 0.020%), West Indian (7.9%, a difference of 0.050%), Immigrants from Trinidad and Tobago (7.9%, a difference of 0.18%), Jamaican (7.9%, a difference of 0.20%), and Blackfeet (7.9%, a difference of 0.43%).
| Demographics | Rating | Rank | Unemployment Among Ages 25 to 29 years |
| Chippewa | 0.0 /100 | #292 | Tragic 7.8% |
| Immigrants | Belize | 0.0 /100 | #293 | Tragic 7.8% |
| Trinidadians and Tobagonians | 0.0 /100 | #294 | Tragic 7.8% |
| Comanche | 0.0 /100 | #295 | Tragic 7.8% |
| Immigrants | West Indies | 0.0 /100 | #296 | Tragic 7.8% |
| Blackfeet | 0.0 /100 | #297 | Tragic 7.9% |
| Immigrants | Trinidad and Tobago | 0.0 /100 | #298 | Tragic 7.9% |
| Barbadians | 0.0 /100 | #299 | Tragic 7.9% |
| Central American Indians | 0.0 /100 | #300 | Tragic 7.9% |
| West Indians | 0.0 /100 | #301 | Tragic 7.9% |
| Jamaicans | 0.0 /100 | #302 | Tragic 7.9% |
| Immigrants | Yemen | 0.0 /100 | #303 | Tragic 8.0% |
| Cajuns | 0.0 /100 | #304 | Tragic 8.0% |
| Tsimshian | 0.0 /100 | #305 | Tragic 8.0% |
| Haitians | 0.0 /100 | #306 | Tragic 8.0% |