Immigrants from Ecuador vs Seminole Unemployment Among Seniors over 65 years
COMPARE
Immigrants from Ecuador
Seminole
Unemployment Among Seniors over 65 years
Unemployment Among Seniors over 65 years Comparison
Immigrants from Ecuador
Seminole
5.6%
UNEMPLOYMENT AMONG SENIORS OVER 65 YEARS
0.0/ 100
METRIC RATING
312th/ 347
METRIC RANK
5.0%
UNEMPLOYMENT AMONG SENIORS OVER 65 YEARS
91.4/ 100
METRIC RATING
113th/ 347
METRIC RANK
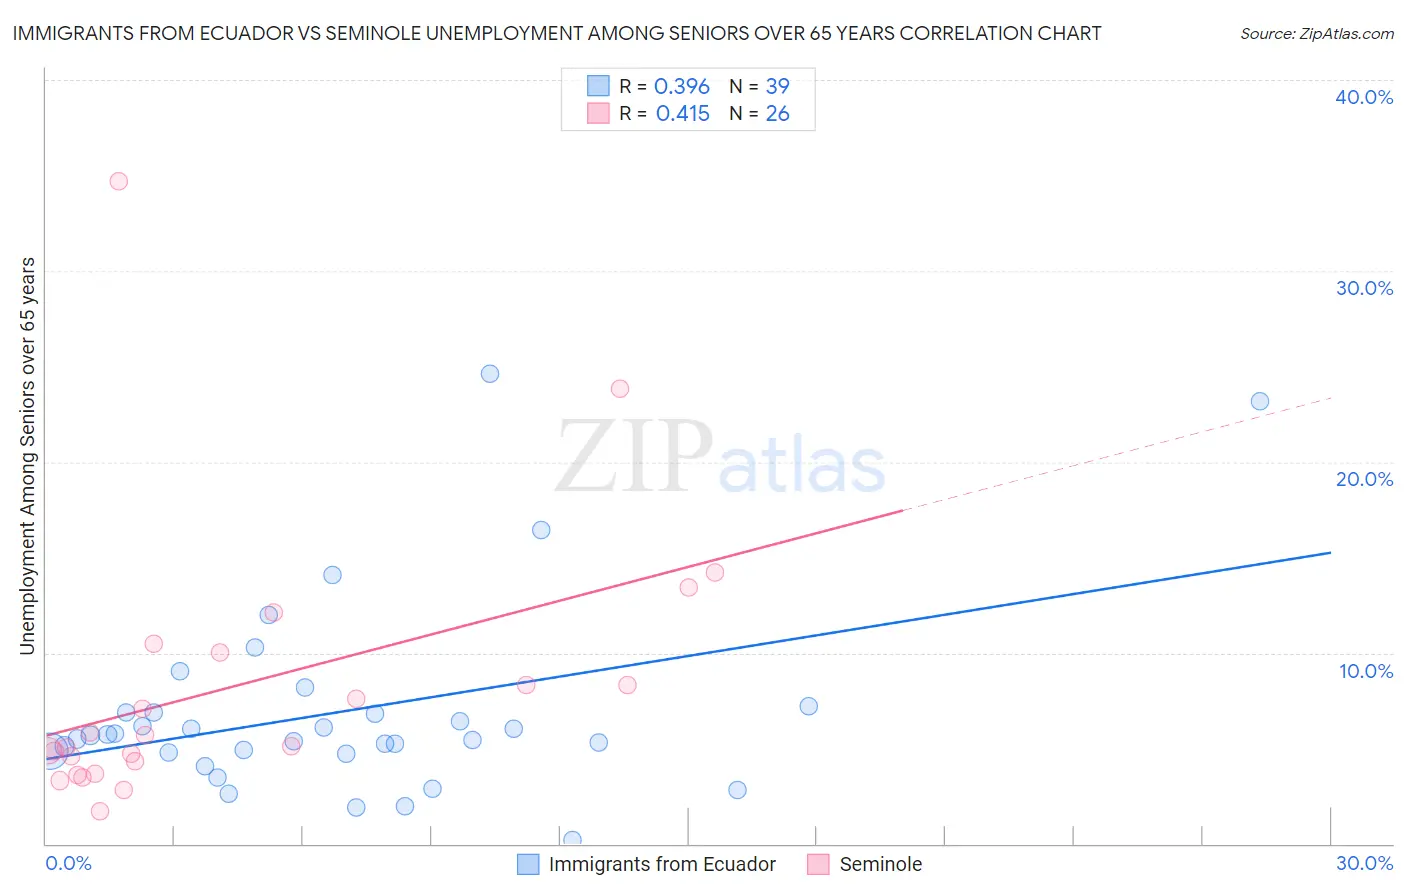
Immigrants from Ecuador vs Seminole Unemployment Among Seniors over 65 years Correlation Chart
The statistical analysis conducted on geographies consisting of 254,673,342 people shows a mild positive correlation between the proportion of Immigrants from Ecuador and unemployment rate amomg seniors over the age of 65 in the United States with a correlation coefficient (R) of 0.396 and weighted average of 5.6%. Similarly, the statistical analysis conducted on geographies consisting of 112,443,018 people shows a moderate positive correlation between the proportion of Seminole and unemployment rate amomg seniors over the age of 65 in the United States with a correlation coefficient (R) of 0.415 and weighted average of 5.0%, a difference of 11.7%.
Unemployment Among Seniors over 65 years Correlation Summary
| Measurement | Immigrants from Ecuador | Seminole |
| Minimum | 0.20% | 1.7% |
| Maximum | 24.6% | 34.7% |
| Range | 24.4% | 33.0% |
| Mean | 6.9% | 8.2% |
| Median | 5.7% | 5.4% |
| Interquartile 25% (IQ1) | 4.8% | 4.3% |
| Interquartile 75% (IQ3) | 6.9% | 10.0% |
| Interquartile Range (IQR) | 2.1% | 5.7% |
| Standard Deviation (Sample) | 5.1% | 7.2% |
| Standard Deviation (Population) | 5.0% | 7.0% |
Similar Demographics by Unemployment Among Seniors over 65 years
Demographics Similar to Immigrants from Ecuador by Unemployment Among Seniors over 65 years
In terms of unemployment among seniors over 65 years, the demographic groups most similar to Immigrants from Ecuador are Barbadian (5.6%, a difference of 0.030%), Immigrants from Guyana (5.6%, a difference of 0.14%), Salvadoran (5.6%, a difference of 0.27%), Immigrants from Guatemala (5.6%, a difference of 0.31%), and Immigrants from St. Vincent and the Grenadines (5.6%, a difference of 0.53%).
| Demographics | Rating | Rank | Unemployment Among Seniors over 65 years |
| Mexicans | 0.0 /100 | #305 | Tragic 5.6% |
| Ecuadorians | 0.0 /100 | #306 | Tragic 5.6% |
| Portuguese | 0.0 /100 | #307 | Tragic 5.6% |
| Immigrants | St. Vincent and the Grenadines | 0.0 /100 | #308 | Tragic 5.6% |
| Immigrants | Guatemala | 0.0 /100 | #309 | Tragic 5.6% |
| Salvadorans | 0.0 /100 | #310 | Tragic 5.6% |
| Immigrants | Guyana | 0.0 /100 | #311 | Tragic 5.6% |
| Immigrants | Ecuador | 0.0 /100 | #312 | Tragic 5.6% |
| Barbadians | 0.0 /100 | #313 | Tragic 5.6% |
| Delaware | 0.0 /100 | #314 | Tragic 5.7% |
| Immigrants | El Salvador | 0.0 /100 | #315 | Tragic 5.7% |
| Immigrants | Central America | 0.0 /100 | #316 | Tragic 5.7% |
| Immigrants | Bahamas | 0.0 /100 | #317 | Tragic 5.7% |
| Vietnamese | 0.0 /100 | #318 | Tragic 5.7% |
| Immigrants | Bangladesh | 0.0 /100 | #319 | Tragic 5.7% |
Demographics Similar to Seminole by Unemployment Among Seniors over 65 years
In terms of unemployment among seniors over 65 years, the demographic groups most similar to Seminole are Immigrants from Latvia (5.0%, a difference of 0.0%), Celtic (5.0%, a difference of 0.010%), Immigrants from Korea (5.0%, a difference of 0.040%), Eastern European (5.0%, a difference of 0.060%), and Finnish (5.0%, a difference of 0.080%).
| Demographics | Rating | Rank | Unemployment Among Seniors over 65 years |
| Immigrants | Turkey | 94.3 /100 | #106 | Exceptional 5.0% |
| Immigrants | Germany | 93.2 /100 | #107 | Exceptional 5.0% |
| Immigrants | Vietnam | 92.9 /100 | #108 | Exceptional 5.0% |
| Immigrants | Malaysia | 92.7 /100 | #109 | Exceptional 5.0% |
| Immigrants | Saudi Arabia | 92.7 /100 | #110 | Exceptional 5.0% |
| Finns | 92.2 /100 | #111 | Exceptional 5.0% |
| Eastern Europeans | 92.0 /100 | #112 | Exceptional 5.0% |
| Seminole | 91.4 /100 | #113 | Exceptional 5.0% |
| Immigrants | Latvia | 91.4 /100 | #114 | Exceptional 5.0% |
| Celtics | 91.3 /100 | #115 | Exceptional 5.0% |
| Immigrants | Korea | 91.0 /100 | #116 | Exceptional 5.0% |
| Malaysians | 90.4 /100 | #117 | Exceptional 5.1% |
| Soviet Union | 90.1 /100 | #118 | Exceptional 5.1% |
| Immigrants | Canada | 89.7 /100 | #119 | Excellent 5.1% |
| Irish | 88.8 /100 | #120 | Excellent 5.1% |