Immigrants from Taiwan vs Immigrants from El Salvador Unemployment
COMPARE
Immigrants from Taiwan
Immigrants from El Salvador
Unemployment
Unemployment Comparison
Immigrants from Taiwan
Immigrants from El Salvador
4.8%
UNEMPLOYMENT
99.4/ 100
METRIC RATING
47th/ 347
METRIC RANK
5.8%
UNEMPLOYMENT
0.1/ 100
METRIC RATING
269th/ 347
METRIC RANK
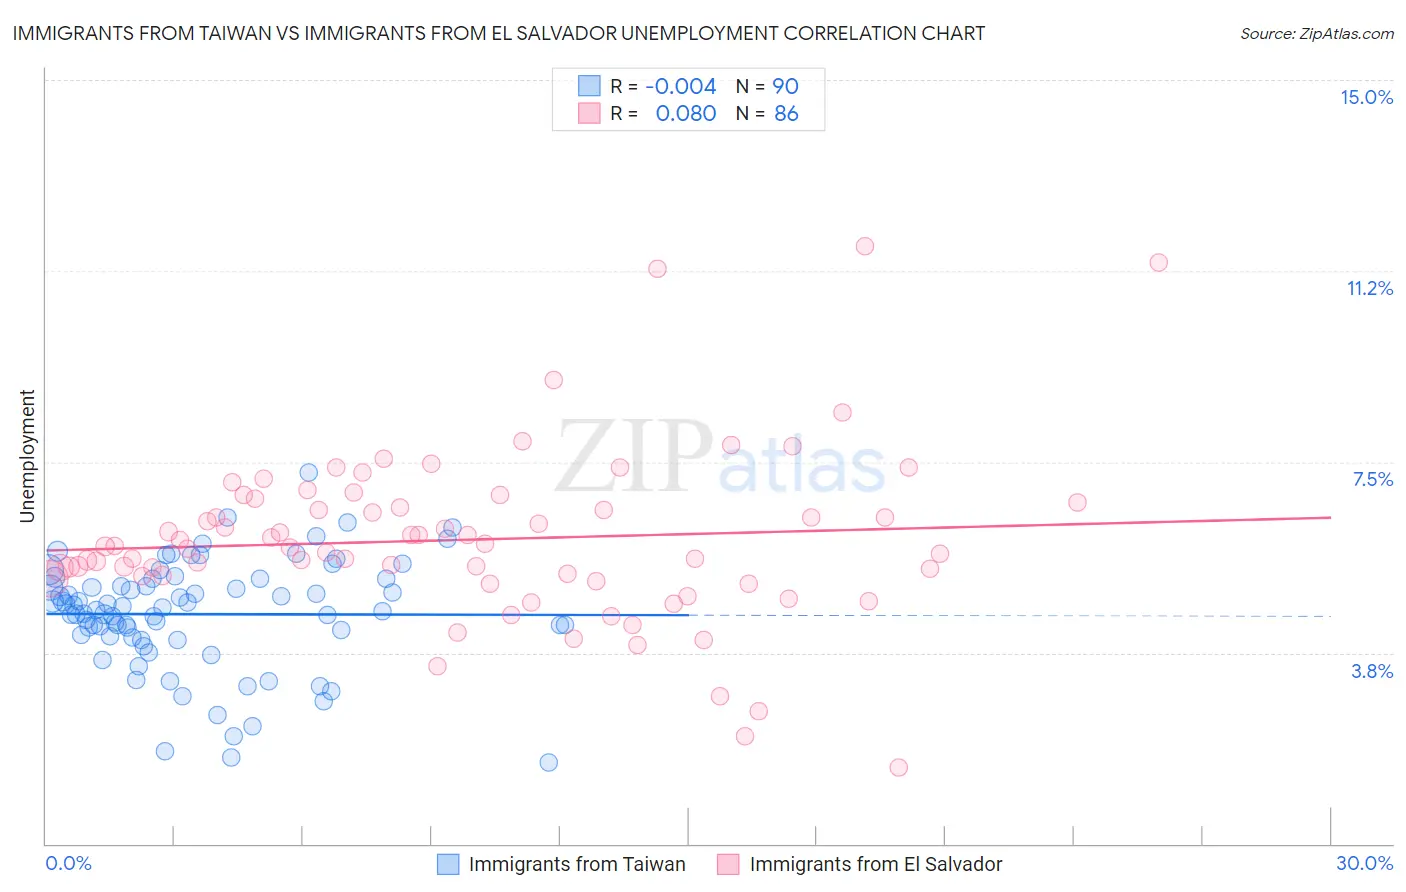
Immigrants from Taiwan vs Immigrants from El Salvador Unemployment Correlation Chart
The statistical analysis conducted on geographies consisting of 298,179,834 people shows no correlation between the proportion of Immigrants from Taiwan and unemployment in the United States with a correlation coefficient (R) of -0.004 and weighted average of 4.8%. Similarly, the statistical analysis conducted on geographies consisting of 357,477,552 people shows a slight positive correlation between the proportion of Immigrants from El Salvador and unemployment in the United States with a correlation coefficient (R) of 0.080 and weighted average of 5.8%, a difference of 20.5%.
Unemployment Correlation Summary
| Measurement | Immigrants from Taiwan | Immigrants from El Salvador |
| Minimum | 1.6% | 1.5% |
| Maximum | 7.3% | 11.7% |
| Range | 5.7% | 10.2% |
| Mean | 4.5% | 6.0% |
| Median | 4.6% | 5.8% |
| Interquartile 25% (IQ1) | 4.1% | 5.3% |
| Interquartile 75% (IQ3) | 5.2% | 6.7% |
| Interquartile Range (IQR) | 1.1% | 1.4% |
| Standard Deviation (Sample) | 1.1% | 1.7% |
| Standard Deviation (Population) | 1.1% | 1.7% |
Similar Demographics by Unemployment
Demographics Similar to Immigrants from Taiwan by Unemployment
In terms of unemployment, the demographic groups most similar to Immigrants from Taiwan are Immigrants from Nepal (4.8%, a difference of 0.020%), French (4.8%, a difference of 0.18%), Immigrants from Scotland (4.9%, a difference of 0.22%), Immigrants from South Central Asia (4.9%, a difference of 0.22%), and Austrian (4.8%, a difference of 0.24%).
| Demographics | Rating | Rank | Unemployment |
| Northern Europeans | 99.7 /100 | #40 | Exceptional 4.8% |
| Immigrants | Bosnia and Herzegovina | 99.7 /100 | #41 | Exceptional 4.8% |
| Filipinos | 99.5 /100 | #42 | Exceptional 4.8% |
| Yugoslavians | 99.5 /100 | #43 | Exceptional 4.8% |
| Austrians | 99.5 /100 | #44 | Exceptional 4.8% |
| French | 99.5 /100 | #45 | Exceptional 4.8% |
| Immigrants | Nepal | 99.4 /100 | #46 | Exceptional 4.8% |
| Immigrants | Taiwan | 99.4 /100 | #47 | Exceptional 4.8% |
| Immigrants | Scotland | 99.3 /100 | #48 | Exceptional 4.9% |
| Immigrants | South Central Asia | 99.3 /100 | #49 | Exceptional 4.9% |
| French Canadians | 99.3 /100 | #50 | Exceptional 4.9% |
| Immigrants | Belgium | 99.2 /100 | #51 | Exceptional 4.9% |
| Whites/Caucasians | 99.2 /100 | #52 | Exceptional 4.9% |
| Immigrants | Zimbabwe | 99.2 /100 | #53 | Exceptional 4.9% |
| Eastern Europeans | 99.2 /100 | #54 | Exceptional 4.9% |
Demographics Similar to Immigrants from El Salvador by Unemployment
In terms of unemployment, the demographic groups most similar to Immigrants from El Salvador are Immigrants from Sierra Leone (5.8%, a difference of 0.010%), Immigrants from Nigeria (5.8%, a difference of 0.050%), Blackfeet (5.8%, a difference of 0.080%), Mexican American Indian (5.8%, a difference of 0.12%), and Mexican (5.9%, a difference of 0.31%).
| Demographics | Rating | Rank | Unemployment |
| Sierra Leoneans | 0.1 /100 | #262 | Tragic 5.8% |
| Salvadorans | 0.1 /100 | #263 | Tragic 5.8% |
| Immigrants | Liberia | 0.1 /100 | #264 | Tragic 5.8% |
| Nigerians | 0.1 /100 | #265 | Tragic 5.8% |
| Mexican American Indians | 0.1 /100 | #266 | Tragic 5.8% |
| Immigrants | Nigeria | 0.1 /100 | #267 | Tragic 5.8% |
| Immigrants | Sierra Leone | 0.1 /100 | #268 | Tragic 5.8% |
| Immigrants | El Salvador | 0.1 /100 | #269 | Tragic 5.8% |
| Blackfeet | 0.1 /100 | #270 | Tragic 5.8% |
| Mexicans | 0.1 /100 | #271 | Tragic 5.9% |
| Hispanics or Latinos | 0.0 /100 | #272 | Tragic 5.9% |
| Immigrants | Fiji | 0.0 /100 | #273 | Tragic 5.9% |
| Bahamians | 0.0 /100 | #274 | Tragic 5.9% |
| Immigrants | Latin America | 0.0 /100 | #275 | Tragic 5.9% |
| Immigrants | Central America | 0.0 /100 | #276 | Tragic 6.0% |