Immigrants from Ecuador vs French Canadian Female Unemployment
COMPARE
Immigrants from Ecuador
French Canadian
Female Unemployment
Female Unemployment Comparison
Immigrants from Ecuador
French Canadians
6.4%
FEMALE UNEMPLOYMENT
0.0/ 100
METRIC RATING
314th/ 347
METRIC RANK
4.8%
FEMALE UNEMPLOYMENT
99.7/ 100
METRIC RATING
35th/ 347
METRIC RANK
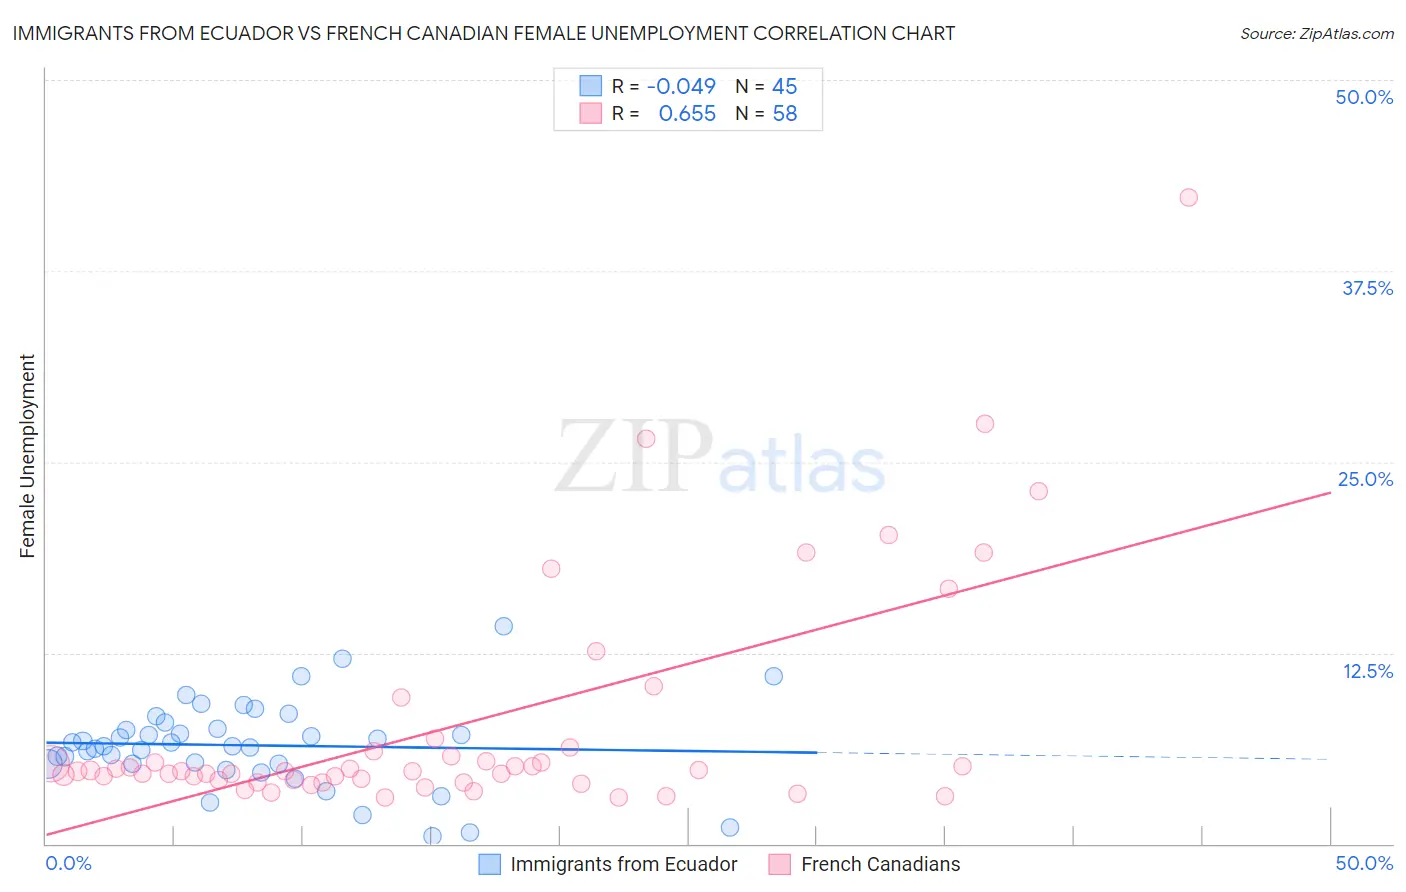
Immigrants from Ecuador vs French Canadian Female Unemployment Correlation Chart
The statistical analysis conducted on geographies consisting of 270,415,803 people shows no correlation between the proportion of Immigrants from Ecuador and unemploymnet rate among females in the United States with a correlation coefficient (R) of -0.049 and weighted average of 6.4%. Similarly, the statistical analysis conducted on geographies consisting of 495,462,199 people shows a significant positive correlation between the proportion of French Canadians and unemploymnet rate among females in the United States with a correlation coefficient (R) of 0.655 and weighted average of 4.8%, a difference of 32.7%.
Female Unemployment Correlation Summary
| Measurement | Immigrants from Ecuador | French Canadian |
| Minimum | 0.51% | 3.0% |
| Maximum | 14.2% | 42.3% |
| Range | 13.7% | 39.3% |
| Mean | 6.4% | 7.8% |
| Median | 6.4% | 4.7% |
| Interquartile 25% (IQ1) | 5.2% | 4.1% |
| Interquartile 75% (IQ3) | 7.7% | 6.0% |
| Interquartile Range (IQR) | 2.5% | 1.9% |
| Standard Deviation (Sample) | 2.8% | 7.6% |
| Standard Deviation (Population) | 2.8% | 7.6% |
Similar Demographics by Female Unemployment
Demographics Similar to Immigrants from Ecuador by Female Unemployment
In terms of female unemployment, the demographic groups most similar to Immigrants from Ecuador are Belizean (6.3%, a difference of 0.23%), Immigrants from Grenada (6.3%, a difference of 0.24%), Pueblo (6.4%, a difference of 0.31%), Houma (6.4%, a difference of 0.60%), and Immigrants from Mexico (6.3%, a difference of 0.90%).
| Demographics | Rating | Rank | Female Unemployment |
| Shoshone | 0.0 /100 | #307 | Tragic 6.2% |
| Hispanics or Latinos | 0.0 /100 | #308 | Tragic 6.2% |
| Ecuadorians | 0.0 /100 | #309 | Tragic 6.3% |
| Central American Indians | 0.0 /100 | #310 | Tragic 6.3% |
| Immigrants | Mexico | 0.0 /100 | #311 | Tragic 6.3% |
| Immigrants | Grenada | 0.0 /100 | #312 | Tragic 6.3% |
| Belizeans | 0.0 /100 | #313 | Tragic 6.3% |
| Immigrants | Ecuador | 0.0 /100 | #314 | Tragic 6.4% |
| Pueblo | 0.0 /100 | #315 | Tragic 6.4% |
| Houma | 0.0 /100 | #316 | Tragic 6.4% |
| Immigrants | St. Vincent and the Grenadines | 0.0 /100 | #317 | Tragic 6.4% |
| British West Indians | 0.0 /100 | #318 | Tragic 6.4% |
| Immigrants | Bangladesh | 0.0 /100 | #319 | Tragic 6.5% |
| Immigrants | Dominica | 0.0 /100 | #320 | Tragic 6.5% |
| Blacks/African Americans | 0.0 /100 | #321 | Tragic 6.5% |
Demographics Similar to French Canadians by Female Unemployment
In terms of female unemployment, the demographic groups most similar to French Canadians are Zimbabwean (4.8%, a difference of 0.060%), Czechoslovakian (4.8%, a difference of 0.10%), Yugoslavian (4.8%, a difference of 0.15%), Pennsylvania German (4.8%, a difference of 0.51%), and Slovak (4.8%, a difference of 0.61%).
| Demographics | Rating | Rank | Female Unemployment |
| Irish | 99.9 /100 | #28 | Exceptional 4.7% |
| Cypriots | 99.9 /100 | #29 | Exceptional 4.7% |
| Lithuanians | 99.8 /100 | #30 | Exceptional 4.7% |
| Sudanese | 99.8 /100 | #31 | Exceptional 4.8% |
| Slovaks | 99.8 /100 | #32 | Exceptional 4.8% |
| Czechoslovakians | 99.7 /100 | #33 | Exceptional 4.8% |
| Zimbabweans | 99.7 /100 | #34 | Exceptional 4.8% |
| French Canadians | 99.7 /100 | #35 | Exceptional 4.8% |
| Yugoslavians | 99.7 /100 | #36 | Exceptional 4.8% |
| Pennsylvania Germans | 99.6 /100 | #37 | Exceptional 4.8% |
| Northern Europeans | 99.6 /100 | #38 | Exceptional 4.8% |
| Scotch-Irish | 99.6 /100 | #39 | Exceptional 4.8% |
| French | 99.6 /100 | #40 | Exceptional 4.8% |
| Tongans | 99.5 /100 | #41 | Exceptional 4.8% |
| Italians | 99.5 /100 | #42 | Exceptional 4.8% |