Immigrants from Eastern Asia vs Maltese Unemployment

COMPARE

Immigrants from Eastern Asia
Race
Ancestry
AfghanAfricanAlaska NativeAlaskan AthabascanAlbanianAleutAlsatianAmericanApacheArabArapahoArgentineanArmenianAssyrian/Chaldean/SyriacAustralianAustrianBahamianBangladeshiBarbadianBasqueBelgianBelizeanBermudanBhutaneseBlackfeetBolivianBrazilianBritishBritish West IndianBulgarianBurmeseCajunCambodianCanadianCape VerdeanCarpatho RusynCelticCentral AmericanCentral American IndianCherokeeCheyenneChickasawChileanChineseChippewaChoctawColombianColvilleComancheCosta RicanCreeCreekCroatianCrowCubanCypriotCzechCzechoslovakianDanishDelawareDominicanDutchDutch West IndianEastern EuropeanEcuadorianEgyptianEnglishEstonianEthiopianEuropeanFijianFilipinoFinnishFrenchFrench American IndianFrench CanadianGermanGerman RussianGhanaianGreekGuamanian/ChamorroGuatemalanGuyaneseHaitianHmongHonduranHopiHoumaHungarianIcelanderIndian (Asian)IndonesianInupiatIranianIraqiIrishIroquoisIsraeliItalianJamaicanJapaneseJordanianKenyanKiowaKoreanLaotianLatvianLebaneseLiberianLithuanianLumbeeLuxembourgerMacedonianMalaysianMarshalleseMenomineeMexicanMexican American IndianMongolianMoroccanNative HawaiianNavajoNepaleseNew ZealanderNicaraguanNigerianNorthern EuropeanNorwegianOkinawanOsageOttawaPaiutePakistaniPalestinianPanamanianParaguayanPennsylvania GermanPeruvianPimaPolishPortuguesePotawatomiPuebloPuerto RicanPuget Sound SalishRomanianRussianSalvadoranSamoanScandinavianScotch-IrishScottishSeminoleSenegaleseSerbianShoshoneSierra LeoneanSiouxSlavicSlovakSloveneSomaliSouth AfricanSouth AmericanSouth American IndianSoviet UnionSpaniardSpanishSpanish AmericanSpanish American IndianSri LankanSubsaharan AfricanSudaneseSwedishSwissSyrianTaiwaneseThaiTlingit-HaidaTohono O'OdhamTonganTrinidadian and TobagonianTsimshianTurkishU.S. Virgin IslanderUgandanUkrainianUruguayanUteVenezuelanVietnameseWelshWest IndianYakamaYaquiYugoslavianYumanYup'ikZimbabwean
Immigration
NonimmigrantsImmigrantsAfghanistanAfricaAlbaniaArgentinaArmeniaAsiaAustraliaAustriaBahamasBangladeshBarbadosBelarusBelgiumBelizeBoliviaBosnia and HerzegovinaBrazilBulgariaBurma/MyanmarCabo VerdeCambodiaCameroonCanadaCaribbeanCentral AmericaChileChinaColombiaCongoCosta RicaCroatiaCubaCzechoslovakiaDenmarkDominicaDominican RepublicEastern AfricaEastern AsiaEastern EuropeEcuadorEgyptEl SalvadorEnglandEritreaEthiopiaEuropeFijiFranceGermanyGhanaGreeceGrenadaGuatemalaGuyanaHaitiHondurasHong KongHungaryIndiaIndonesiaIranIraqIrelandIsraelItalyJamaicaJapanJordanKazakhstanKenyaKoreaKuwaitLaosLatin AmericaLatviaLebanonLiberiaLithuaniaMalaysiaMexicoMicronesiaMiddle AfricaMoldovaMoroccoNepalNetherlandsNicaraguaNigeriaNorth AmericaNorth MacedoniaNorthern AfricaNorthern EuropeNorwayOceaniaPakistanPanamaPeruPhilippinesPolandPortugalRomaniaRussiaSaudi ArabiaScotlandSenegalSerbiaSierra LeoneSingaporeSomaliaSouth AfricaSouth AmericaSouth Central AsiaSouth Eastern AsiaSouthern EuropeSpainSri LankaSt. Vincent and the GrenadinesSudanSwedenSwitzerlandSyriaTaiwanThailandTrinidad and TobagoTurkeyUgandaUkraineUruguayUzbekistanVenezuelaVietnamWest IndiesWestern AfricaWestern AsiaWestern EuropeYemenZaireZimbabweAzores
Maltese
Race
Ancestry
AfghanAfricanAlaska NativeAlaskan AthabascanAlbanianAleutAlsatianAmericanApacheArabArapahoArgentineanArmenianAssyrian/Chaldean/SyriacAustralianAustrianBahamianBangladeshiBarbadianBasqueBelgianBelizeanBermudanBhutaneseBlackfeetBolivianBrazilianBritishBritish West IndianBulgarianBurmeseCajunCambodianCanadianCape VerdeanCarpatho RusynCelticCentral AmericanCentral American IndianCherokeeCheyenneChickasawChileanChineseChippewaChoctawColombianColvilleComancheCosta RicanCreeCreekCroatianCrowCubanCypriotCzechCzechoslovakianDanishDelawareDominicanDutchDutch West IndianEastern EuropeanEcuadorianEgyptianEnglishEstonianEthiopianEuropeanFijianFilipinoFinnishFrenchFrench American IndianFrench CanadianGermanGerman RussianGhanaianGreekGuamanian/ChamorroGuatemalanGuyaneseHaitianHmongHonduranHopiHoumaHungarianIcelanderIndian (Asian)IndonesianInupiatIranianIraqiIrishIroquoisIsraeliItalianJamaicanJapaneseJordanianKenyanKiowaKoreanLaotianLatvianLebaneseLiberianLithuanianLumbeeLuxembourgerMacedonianMalaysianMalteseMarshalleseMenomineeMexicanMexican American IndianMongolianMoroccanNative HawaiianNavajoNepaleseNew ZealanderNicaraguanNigerianNorthern EuropeanNorwegianOkinawanOsageOttawaPaiutePakistaniPalestinianPanamanianParaguayanPennsylvania GermanPeruvianPimaPolishPortuguesePotawatomiPuebloPuerto RicanPuget Sound SalishRomanianRussianSalvadoranSamoanScandinavianScotch-IrishScottishSeminoleSenegaleseSerbianShoshoneSierra LeoneanSiouxSlavicSlovakSloveneSomaliSouth AfricanSouth AmericanSouth American IndianSoviet UnionSpaniardSpanishSpanish AmericanSpanish American IndianSri LankanSubsaharan AfricanSudaneseSwedishSwissSyrianTaiwaneseThaiTlingit-HaidaTohono O'OdhamTonganTrinidadian and TobagonianTsimshianTurkishU.S. Virgin IslanderUgandanUkrainianUruguayanUteVenezuelanVietnameseWelshWest IndianYakamaYaquiYugoslavianYumanYup'ikZimbabwean
Immigration
NonimmigrantsImmigrantsAfghanistanAfricaAlbaniaArgentinaArmeniaAsiaAustraliaAustriaBahamasBangladeshBarbadosBelarusBelgiumBelizeBoliviaBosnia and HerzegovinaBrazilBulgariaBurma/MyanmarCabo VerdeCambodiaCameroonCanadaCaribbeanCentral AmericaChileChinaColombiaCongoCosta RicaCroatiaCubaCzechoslovakiaDenmarkDominicaDominican RepublicEastern AfricaEastern EuropeEcuadorEgyptEl SalvadorEnglandEritreaEthiopiaEuropeFijiFranceGermanyGhanaGreeceGrenadaGuatemalaGuyanaHaitiHondurasHong KongHungaryIndiaIndonesiaIranIraqIrelandIsraelItalyJamaicaJapanJordanKazakhstanKenyaKoreaKuwaitLaosLatin AmericaLatviaLebanonLiberiaLithuaniaMalaysiaMexicoMicronesiaMiddle AfricaMoldovaMoroccoNepalNetherlandsNicaraguaNigeriaNorth AmericaNorth MacedoniaNorthern AfricaNorthern EuropeNorwayOceaniaPakistanPanamaPeruPhilippinesPolandPortugalRomaniaRussiaSaudi ArabiaScotlandSenegalSerbiaSierra LeoneSingaporeSomaliaSouth AfricaSouth AmericaSouth Central AsiaSouth Eastern AsiaSouthern EuropeSpainSri LankaSt. Vincent and the GrenadinesSudanSwedenSwitzerlandSyriaTaiwanThailandTrinidad and TobagoTurkeyUgandaUkraineUruguayUzbekistanVenezuelaVietnamWest IndiesWestern AfricaWestern AsiaWestern EuropeYemenZaireZimbabweAzores
Unemployment
Income
Poverty
Unemployment
Labor Participation
Family Structure
Vehicle Availability
Education Level
Disability

Unemployment Comparison

Immigrants from Eastern Asia

Maltese

Excellent
Exceptional
5.1%
UNEMPLOYMENT
88.3/ 100
METRIC RATING
125th/ 347
METRIC RANK
5.0%
UNEMPLOYMENT
94.0/ 100
METRIC RATING
105th/ 347
METRIC RANK

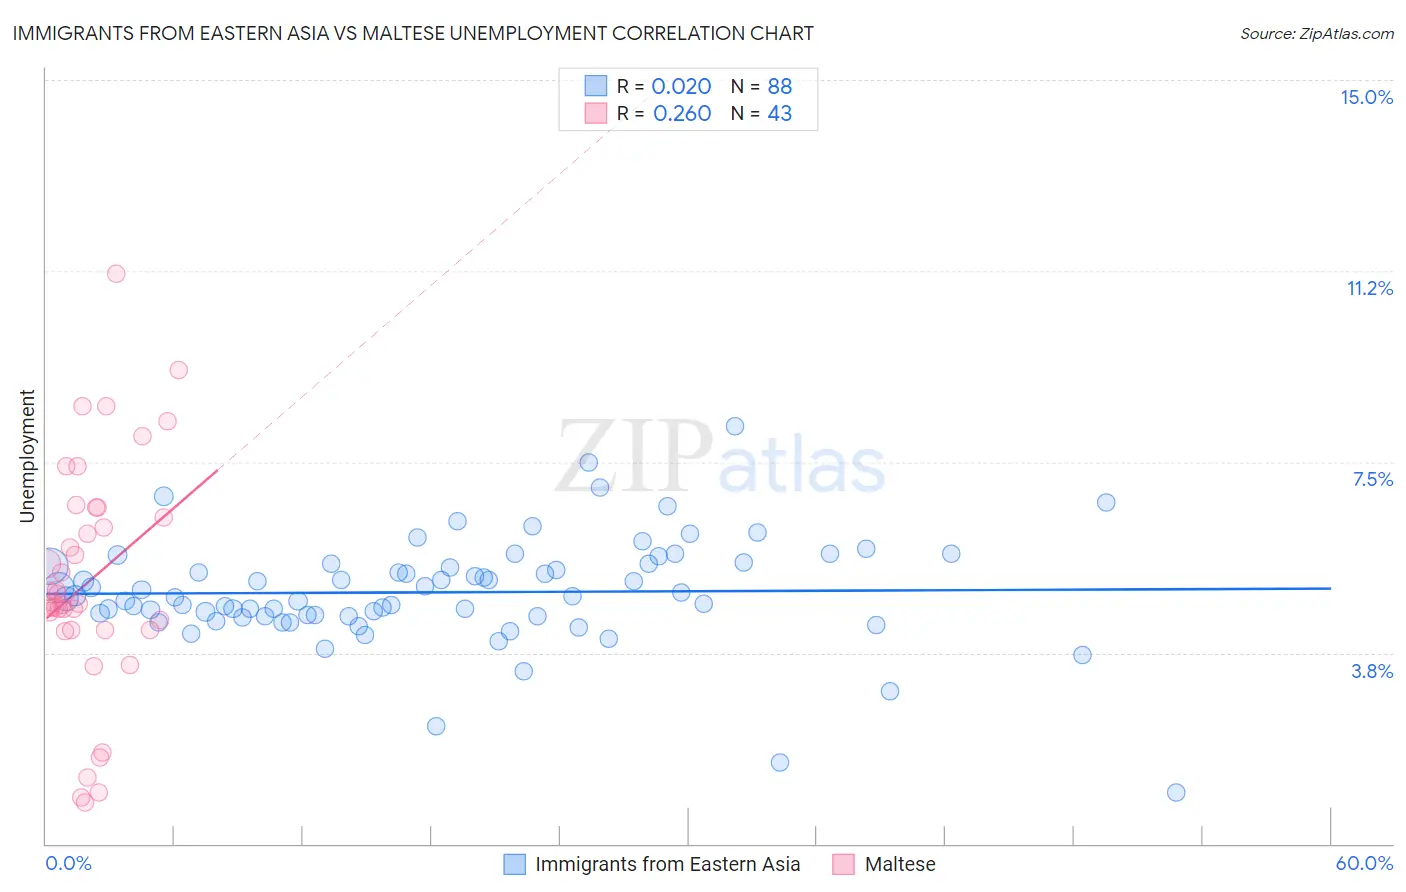
Immigrants from Eastern Asia vs Maltese Unemployment Correlation Chart

The statistical analysis conducted on geographies consisting of 498,945,317 people shows no correlation between the proportion of Immigrants from Eastern Asia and unemployment in the United States with a correlation coefficient (R) of 0.020 and weighted average of 5.1%. Similarly, the statistical analysis conducted on geographies consisting of 126,436,055 people shows a weak positive correlation between the proportion of Maltese and unemployment in the United States with a correlation coefficient (R) of 0.260 and weighted average of 5.0%, a difference of 1.2%.
Immigrants from Eastern Asia vs Maltese Unemployment

Unemployment Correlation Summary

MeasurementImmigrants from Eastern AsiaMaltese
Minimum1.0%0.80%
Maximum8.2%11.2%
Range7.2%10.4%
Mean4.9%5.2%
Median4.8%4.7%
Interquartile 25% (IQ1)4.5%4.2%
Interquartile 75% (IQ3)5.5%6.6%
Interquartile Range (IQR)0.99%2.4%
Standard Deviation (Sample)1.1%2.3%
Standard Deviation (Population)1.1%2.3%

Demographics Similar to Immigrants from Eastern Asia and Maltese by Unemployment

In terms of unemployment, the demographic groups most similar to Immigrants from Eastern Asia are Ethiopian (5.1%, a difference of 0.050%), Asian (5.1%, a difference of 0.10%), Immigrants from Switzerland (5.1%, a difference of 0.13%), Lebanese (5.1%, a difference of 0.14%), and Macedonian (5.1%, a difference of 0.21%). Similarly, the demographic groups most similar to Maltese are Immigrants from Romania (5.0%, a difference of 0.070%), Immigrants from Turkey (5.0%, a difference of 0.080%), Immigrants from Kuwait (5.0%, a difference of 0.080%), Immigrants from Eritrea (5.0%, a difference of 0.19%), and Immigrants from Lithuania (5.0%, a difference of 0.20%).
DemographicsRating | RankUnemployment
Maltese
94.0
/100
|
#105
Exceptional
5.0%
Immigrants | Romania
93.7
/100
|
#106
Exceptional
5.0%
Immigrants | Turkey
93.7
/100
|
#107
Exceptional
5.0%
Immigrants | Kuwait
93.7
/100
|
#108
Exceptional
5.0%
Immigrants | Eritrea
93.3
/100
|
#109
Exceptional
5.0%
Immigrants | Lithuania
93.2
/100
|
#110
Exceptional
5.0%
Chileans
93.2
/100
|
#111
Exceptional
5.0%
South Africans
92.6
/100
|
#112
Exceptional
5.1%
Argentineans
92.4
/100
|
#113
Exceptional
5.1%
Immigrants | Ireland
92.1
/100
|
#114
Exceptional
5.1%
Immigrants | Western Europe
91.1
/100
|
#115
Exceptional
5.1%
Immigrants | Sri Lanka
91.1
/100
|
#116
Exceptional
5.1%
Immigrants | Malaysia
91.0
/100
|
#117
Exceptional
5.1%
Immigrants | Germany
90.8
/100
|
#118
Exceptional
5.1%
Immigrants | France
89.7
/100
|
#119
Excellent
5.1%
Macedonians
89.7
/100
|
#120
Excellent
5.1%
Lebanese
89.2
/100
|
#121
Excellent
5.1%
Immigrants | Switzerland
89.1
/100
|
#122
Excellent
5.1%
Asians
89.0
/100
|
#123
Excellent
5.1%
Ethiopians
88.6
/100
|
#124
Excellent
5.1%
Immigrants | Eastern Asia
88.3
/100
|
#125
Excellent
5.1%