Immigrants from Haiti vs Alaska Native Unemployment Among Ages 16 to 19 years
COMPARE
Immigrants from Haiti
Alaska Native
Unemployment Among Ages 16 to 19 years
Unemployment Among Ages 16 to 19 years Comparison
Immigrants from Haiti
Alaska Natives
20.4%
UNEMPLOYMENT AMONG AGES 16 TO 19 YEARS
0.0/ 100
METRIC RATING
294th/ 347
METRIC RANK
21.8%
UNEMPLOYMENT AMONG AGES 16 TO 19 YEARS
0.0/ 100
METRIC RATING
314th/ 347
METRIC RANK
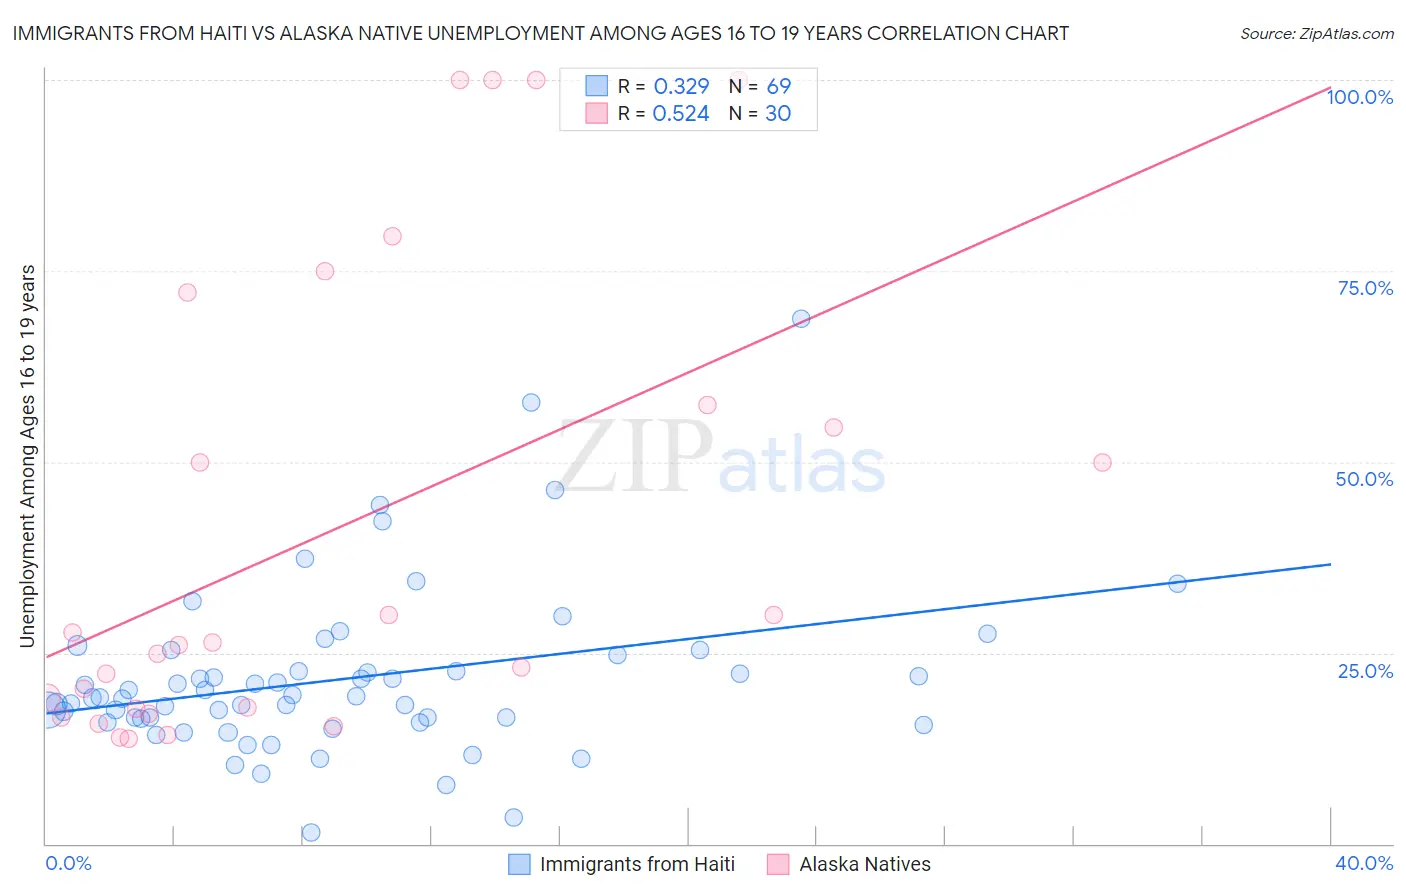
Immigrants from Haiti vs Alaska Native Unemployment Among Ages 16 to 19 years Correlation Chart
The statistical analysis conducted on geographies consisting of 217,842,673 people shows a mild positive correlation between the proportion of Immigrants from Haiti and unemployment rate among population between the ages 16 and 19 in the United States with a correlation coefficient (R) of 0.329 and weighted average of 20.4%. Similarly, the statistical analysis conducted on geographies consisting of 76,044,385 people shows a substantial positive correlation between the proportion of Alaska Natives and unemployment rate among population between the ages 16 and 19 in the United States with a correlation coefficient (R) of 0.524 and weighted average of 21.8%, a difference of 6.5%.
Unemployment Among Ages 16 to 19 years Correlation Summary
| Measurement | Immigrants from Haiti | Alaska Native |
| Minimum | 1.4% | 13.8% |
| Maximum | 68.8% | 100.0% |
| Range | 67.4% | 86.2% |
| Mean | 21.6% | 41.0% |
| Median | 19.1% | 26.2% |
| Interquartile 25% (IQ1) | 16.1% | 17.7% |
| Interquartile 75% (IQ3) | 23.7% | 57.5% |
| Interquartile Range (IQR) | 7.5% | 39.7% |
| Standard Deviation (Sample) | 11.0% | 30.3% |
| Standard Deviation (Population) | 10.9% | 29.8% |
Demographics Similar to Immigrants from Haiti and Alaska Natives by Unemployment Among Ages 16 to 19 years
In terms of unemployment among ages 16 to 19 years, the demographic groups most similar to Immigrants from Haiti are Central American Indian (20.4%, a difference of 0.060%), Armenian (20.5%, a difference of 0.35%), Alsatian (20.5%, a difference of 0.38%), Haitian (20.5%, a difference of 0.43%), and Immigrants from Uzbekistan (20.5%, a difference of 0.48%). Similarly, the demographic groups most similar to Alaska Natives are Jamaican (21.7%, a difference of 0.16%), Houma (21.6%, a difference of 0.58%), Belizean (21.6%, a difference of 0.84%), Vietnamese (21.5%, a difference of 1.1%), and Native/Alaskan (21.5%, a difference of 1.1%).
| Demographics | Rating | Rank | Unemployment Among Ages 16 to 19 years |
| Immigrants | Haiti | 0.0 /100 | #294 | Tragic 20.4% |
| Central American Indians | 0.0 /100 | #295 | Tragic 20.4% |
| Armenians | 0.0 /100 | #296 | Tragic 20.5% |
| Alsatians | 0.0 /100 | #297 | Tragic 20.5% |
| Haitians | 0.0 /100 | #298 | Tragic 20.5% |
| Immigrants | Uzbekistan | 0.0 /100 | #299 | Tragic 20.5% |
| Ecuadorians | 0.0 /100 | #300 | Tragic 20.5% |
| Immigrants | Ecuador | 0.0 /100 | #301 | Tragic 20.9% |
| Immigrants | Caribbean | 0.0 /100 | #302 | Tragic 20.9% |
| Senegalese | 0.0 /100 | #303 | Tragic 21.0% |
| Aleuts | 0.0 /100 | #304 | Tragic 21.2% |
| Immigrants | Senegal | 0.0 /100 | #305 | Tragic 21.2% |
| U.S. Virgin Islanders | 0.0 /100 | #306 | Tragic 21.3% |
| Blacks/African Americans | 0.0 /100 | #307 | Tragic 21.4% |
| Immigrants | Bangladesh | 0.0 /100 | #308 | Tragic 21.5% |
| Natives/Alaskans | 0.0 /100 | #309 | Tragic 21.5% |
| Vietnamese | 0.0 /100 | #310 | Tragic 21.5% |
| Belizeans | 0.0 /100 | #311 | Tragic 21.6% |
| Houma | 0.0 /100 | #312 | Tragic 21.6% |
| Jamaicans | 0.0 /100 | #313 | Tragic 21.7% |
| Alaska Natives | 0.0 /100 | #314 | Tragic 21.8% |