Immigrants from Eastern Africa vs Cajun Female Unemployment
COMPARE
Immigrants from Eastern Africa
Cajun
Female Unemployment
Female Unemployment Comparison
Immigrants from Eastern Africa
Cajuns
5.1%
FEMALE UNEMPLOYMENT
92.8/ 100
METRIC RATING
109th/ 347
METRIC RANK
5.7%
FEMALE UNEMPLOYMENT
0.7/ 100
METRIC RATING
252nd/ 347
METRIC RANK
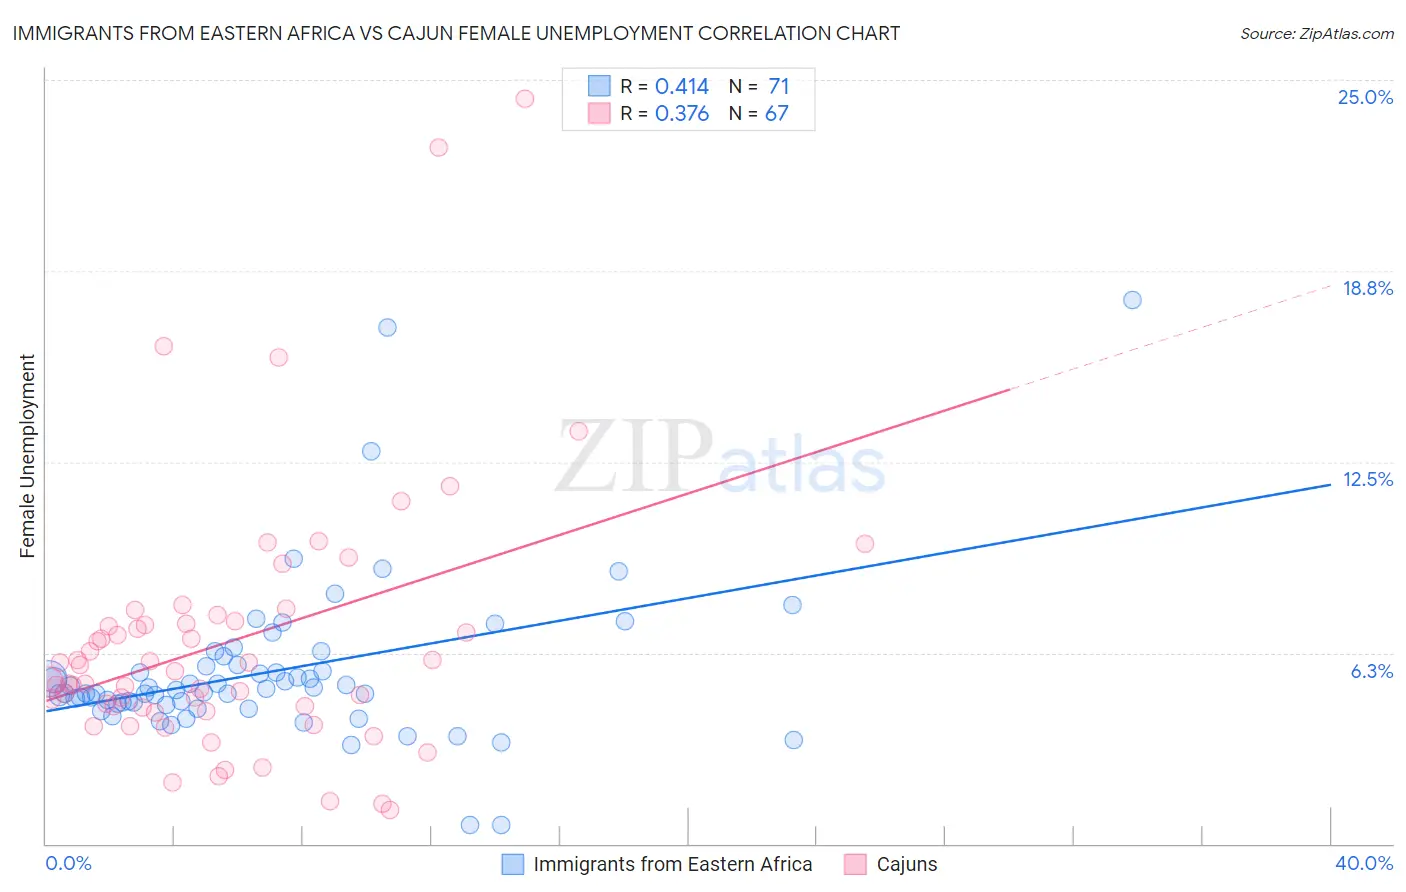
Immigrants from Eastern Africa vs Cajun Female Unemployment Correlation Chart
The statistical analysis conducted on geographies consisting of 354,148,137 people shows a moderate positive correlation between the proportion of Immigrants from Eastern Africa and unemploymnet rate among females in the United States with a correlation coefficient (R) of 0.414 and weighted average of 5.1%. Similarly, the statistical analysis conducted on geographies consisting of 149,152,884 people shows a mild positive correlation between the proportion of Cajuns and unemploymnet rate among females in the United States with a correlation coefficient (R) of 0.376 and weighted average of 5.7%, a difference of 11.8%.
Female Unemployment Correlation Summary
| Measurement | Immigrants from Eastern Africa | Cajun |
| Minimum | 0.60% | 1.1% |
| Maximum | 17.8% | 24.4% |
| Range | 17.2% | 23.3% |
| Mean | 5.6% | 6.6% |
| Median | 5.0% | 5.6% |
| Interquartile 25% (IQ1) | 4.6% | 4.4% |
| Interquartile 75% (IQ3) | 5.9% | 7.3% |
| Interquartile Range (IQR) | 1.3% | 2.8% |
| Standard Deviation (Sample) | 2.7% | 4.3% |
| Standard Deviation (Population) | 2.7% | 4.2% |
Similar Demographics by Female Unemployment
Demographics Similar to Immigrants from Eastern Africa by Female Unemployment
In terms of female unemployment, the demographic groups most similar to Immigrants from Eastern Africa are Puget Sound Salish (5.1%, a difference of 0.040%), Immigrants from Switzerland (5.1%, a difference of 0.060%), Paraguayan (5.1%, a difference of 0.090%), Macedonian (5.1%, a difference of 0.10%), and Immigrants from Burma/Myanmar (5.1%, a difference of 0.13%).
| Demographics | Rating | Rank | Female Unemployment |
| Immigrants | Kenya | 94.8 /100 | #102 | Exceptional 5.0% |
| Somalis | 94.6 /100 | #103 | Exceptional 5.0% |
| Kenyans | 93.7 /100 | #104 | Exceptional 5.0% |
| Immigrants | England | 93.6 /100 | #105 | Exceptional 5.0% |
| Paraguayans | 93.2 /100 | #106 | Exceptional 5.1% |
| Immigrants | Switzerland | 93.1 /100 | #107 | Exceptional 5.1% |
| Puget Sound Salish | 93.0 /100 | #108 | Exceptional 5.1% |
| Immigrants | Eastern Africa | 92.8 /100 | #109 | Exceptional 5.1% |
| Macedonians | 92.4 /100 | #110 | Exceptional 5.1% |
| Immigrants | Burma/Myanmar | 92.3 /100 | #111 | Exceptional 5.1% |
| Estonians | 92.1 /100 | #112 | Exceptional 5.1% |
| Immigrants | Saudi Arabia | 91.2 /100 | #113 | Exceptional 5.1% |
| Immigrants | Turkey | 91.0 /100 | #114 | Exceptional 5.1% |
| Lebanese | 91.0 /100 | #115 | Exceptional 5.1% |
| Americans | 90.5 /100 | #116 | Exceptional 5.1% |
Demographics Similar to Cajuns by Female Unemployment
In terms of female unemployment, the demographic groups most similar to Cajuns are Immigrants from Sierra Leone (5.7%, a difference of 0.15%), Immigrants (5.7%, a difference of 0.15%), Immigrants from Cameroon (5.7%, a difference of 0.18%), Assyrian/Chaldean/Syriac (5.6%, a difference of 0.20%), and Immigrants from Syria (5.6%, a difference of 0.26%).
| Demographics | Rating | Rank | Female Unemployment |
| Guamanians/Chamorros | 1.4 /100 | #245 | Tragic 5.6% |
| Japanese | 1.2 /100 | #246 | Tragic 5.6% |
| Immigrants | Western Asia | 1.1 /100 | #247 | Tragic 5.6% |
| Cree | 1.0 /100 | #248 | Tragic 5.6% |
| Immigrants | Uzbekistan | 1.0 /100 | #249 | Tragic 5.6% |
| Immigrants | Syria | 0.8 /100 | #250 | Tragic 5.6% |
| Assyrians/Chaldeans/Syriacs | 0.8 /100 | #251 | Tragic 5.6% |
| Cajuns | 0.7 /100 | #252 | Tragic 5.7% |
| Immigrants | Sierra Leone | 0.6 /100 | #253 | Tragic 5.7% |
| Immigrants | Immigrants | 0.6 /100 | #254 | Tragic 5.7% |
| Immigrants | Cameroon | 0.6 /100 | #255 | Tragic 5.7% |
| Sub-Saharan Africans | 0.4 /100 | #256 | Tragic 5.7% |
| Dutch West Indians | 0.3 /100 | #257 | Tragic 5.7% |
| Immigrants | Portugal | 0.2 /100 | #258 | Tragic 5.8% |
| Immigrants | Fiji | 0.2 /100 | #259 | Tragic 5.8% |