Belizean vs Tohono O'odham Unemployment Among Ages 20 to 24 years
COMPARE
Belizean
Tohono O'odham
Unemployment Among Ages 20 to 24 years
Unemployment Among Ages 20 to 24 years Comparison
Belizeans
Tohono O'odham
11.8%
UNEMPLOYMENT AMONG AGES 20 TO 24 YEARS
0.0/ 100
METRIC RATING
289th/ 347
METRIC RANK
12.5%
UNEMPLOYMENT AMONG AGES 20 TO 24 YEARS
0.0/ 100
METRIC RATING
308th/ 347
METRIC RANK
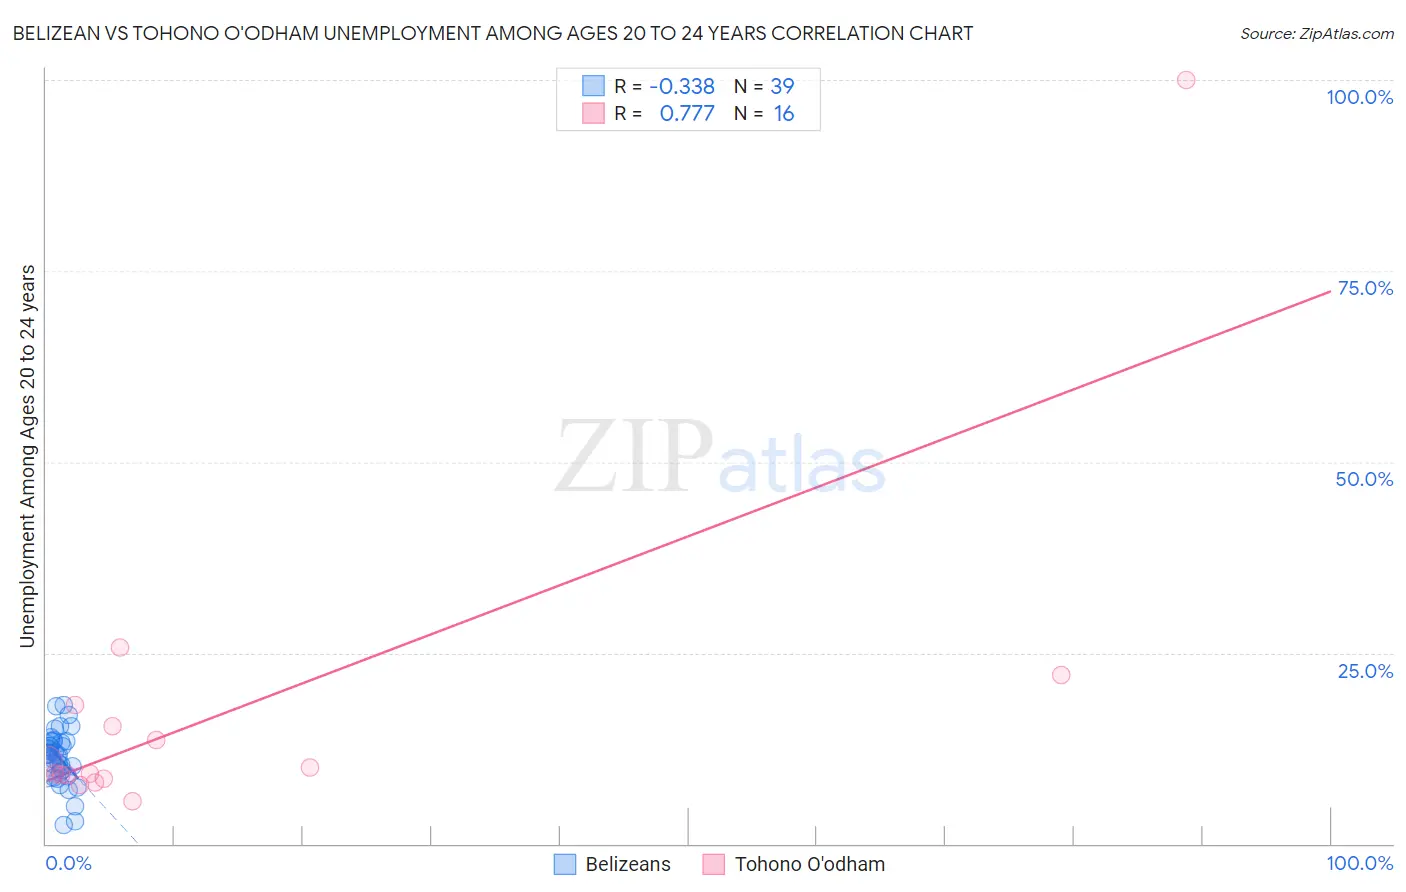
Belizean vs Tohono O'odham Unemployment Among Ages 20 to 24 years Correlation Chart
The statistical analysis conducted on geographies consisting of 143,176,046 people shows a mild negative correlation between the proportion of Belizeans and unemployment rate among population between the ages 20 and 24 in the United States with a correlation coefficient (R) of -0.338 and weighted average of 11.8%. Similarly, the statistical analysis conducted on geographies consisting of 58,461,660 people shows a strong positive correlation between the proportion of Tohono O'odham and unemployment rate among population between the ages 20 and 24 in the United States with a correlation coefficient (R) of 0.777 and weighted average of 12.5%, a difference of 6.2%.
Unemployment Among Ages 20 to 24 years Correlation Summary
| Measurement | Belizean | Tohono O'odham |
| Minimum | 2.4% | 5.5% |
| Maximum | 18.1% | 100.0% |
| Range | 15.7% | 94.5% |
| Mean | 11.3% | 17.6% |
| Median | 11.8% | 9.6% |
| Interquartile 25% (IQ1) | 9.3% | 8.7% |
| Interquartile 75% (IQ3) | 13.4% | 16.8% |
| Interquartile Range (IQR) | 4.1% | 8.0% |
| Standard Deviation (Sample) | 3.5% | 22.7% |
| Standard Deviation (Population) | 3.5% | 21.9% |
Demographics Similar to Belizeans and Tohono O'odham by Unemployment Among Ages 20 to 24 years
In terms of unemployment among ages 20 to 24 years, the demographic groups most similar to Belizeans are Immigrants from Caribbean (11.8%, a difference of 0.21%), U.S. Virgin Islander (11.8%, a difference of 0.29%), Central American Indian (11.9%, a difference of 0.90%), Immigrants from Senegal (11.9%, a difference of 0.98%), and Immigrants from Ghana (11.9%, a difference of 1.2%). Similarly, the demographic groups most similar to Tohono O'odham are Bermudan (12.5%, a difference of 0.68%), Immigrants from Haiti (12.4%, a difference of 1.1%), Chippewa (12.3%, a difference of 2.0%), Immigrants from West Indies (12.3%, a difference of 2.0%), and Haitian (12.2%, a difference of 2.6%).
| Demographics | Rating | Rank | Unemployment Among Ages 20 to 24 years |
| U.S. Virgin Islanders | 0.0 /100 | #288 | Tragic 11.8% |
| Belizeans | 0.0 /100 | #289 | Tragic 11.8% |
| Immigrants | Caribbean | 0.0 /100 | #290 | Tragic 11.8% |
| Central American Indians | 0.0 /100 | #291 | Tragic 11.9% |
| Immigrants | Senegal | 0.0 /100 | #292 | Tragic 11.9% |
| Immigrants | Ghana | 0.0 /100 | #293 | Tragic 11.9% |
| Immigrants | Belize | 0.0 /100 | #294 | Tragic 12.0% |
| Immigrants | Armenia | 0.0 /100 | #295 | Tragic 12.0% |
| Cajuns | 0.0 /100 | #296 | Tragic 12.0% |
| Blackfeet | 0.0 /100 | #297 | Tragic 12.0% |
| Lumbee | 0.0 /100 | #298 | Tragic 12.0% |
| Apache | 0.0 /100 | #299 | Tragic 12.0% |
| Spanish American Indians | 0.0 /100 | #300 | Tragic 12.1% |
| Immigrants | Sierra Leone | 0.0 /100 | #301 | Tragic 12.1% |
| Immigrants | Cabo Verde | 0.0 /100 | #302 | Tragic 12.2% |
| Haitians | 0.0 /100 | #303 | Tragic 12.2% |
| Immigrants | West Indies | 0.0 /100 | #304 | Tragic 12.3% |
| Chippewa | 0.0 /100 | #305 | Tragic 12.3% |
| Immigrants | Haiti | 0.0 /100 | #306 | Tragic 12.4% |
| Bermudans | 0.0 /100 | #307 | Tragic 12.5% |
| Tohono O'odham | 0.0 /100 | #308 | Tragic 12.5% |