Immigrants from Dominica vs Immigrants from Lithuania Unemployment Among Ages 25 to 29 years
COMPARE
Immigrants from Dominica
Immigrants from Lithuania
Unemployment Among Ages 25 to 29 years
Unemployment Among Ages 25 to 29 years Comparison
Immigrants from Dominica
Immigrants from Lithuania
8.4%
UNEMPLOYMENT AMONG AGES 25 TO 29 YEARS
0.0/ 100
METRIC RATING
314th/ 347
METRIC RANK
6.2%
UNEMPLOYMENT AMONG AGES 25 TO 29 YEARS
99.0/ 100
METRIC RATING
46th/ 347
METRIC RANK
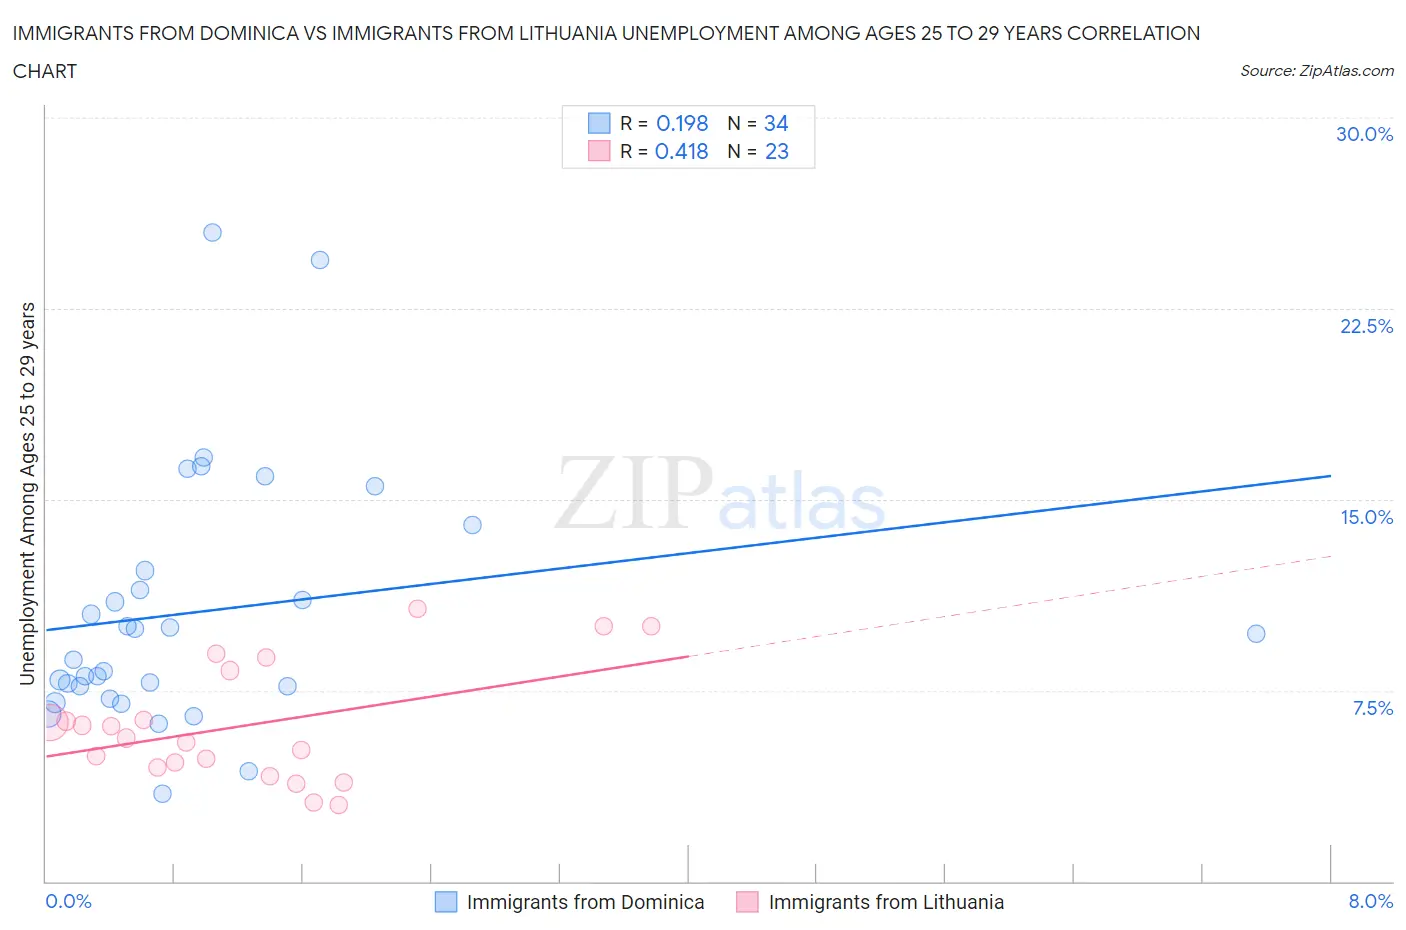
Immigrants from Dominica vs Immigrants from Lithuania Unemployment Among Ages 25 to 29 years Correlation Chart
The statistical analysis conducted on geographies consisting of 82,940,990 people shows a poor positive correlation between the proportion of Immigrants from Dominica and unemployment rate among population between the ages 25 and 29 in the United States with a correlation coefficient (R) of 0.198 and weighted average of 8.4%. Similarly, the statistical analysis conducted on geographies consisting of 115,577,465 people shows a moderate positive correlation between the proportion of Immigrants from Lithuania and unemployment rate among population between the ages 25 and 29 in the United States with a correlation coefficient (R) of 0.418 and weighted average of 6.2%, a difference of 35.9%.
Unemployment Among Ages 25 to 29 years Correlation Summary
| Measurement | Immigrants from Dominica | Immigrants from Lithuania |
| Minimum | 3.4% | 3.0% |
| Maximum | 25.5% | 10.7% |
| Range | 22.1% | 7.7% |
| Mean | 10.6% | 6.1% |
| Median | 9.2% | 5.6% |
| Interquartile 25% (IQ1) | 7.7% | 4.5% |
| Interquartile 75% (IQ3) | 12.2% | 8.3% |
| Interquartile Range (IQR) | 4.5% | 3.8% |
| Standard Deviation (Sample) | 5.0% | 2.3% |
| Standard Deviation (Population) | 4.9% | 2.2% |
Similar Demographics by Unemployment Among Ages 25 to 29 years
Demographics Similar to Immigrants from Dominica by Unemployment Among Ages 25 to 29 years
In terms of unemployment among ages 25 to 29 years, the demographic groups most similar to Immigrants from Dominica are Immigrants from St. Vincent and the Grenadines (8.4%, a difference of 0.35%), British West Indian (8.4%, a difference of 0.59%), Immigrants from Grenada (8.4%, a difference of 0.66%), Immigrants from Guyana (8.5%, a difference of 0.75%), and Guyanese (8.5%, a difference of 1.0%).
| Demographics | Rating | Rank | Unemployment Among Ages 25 to 29 years |
| Immigrants | Barbados | 0.0 /100 | #307 | Tragic 8.0% |
| Immigrants | Jamaica | 0.0 /100 | #308 | Tragic 8.1% |
| Immigrants | Haiti | 0.0 /100 | #309 | Tragic 8.1% |
| U.S. Virgin Islanders | 0.0 /100 | #310 | Tragic 8.1% |
| Immigrants | Azores | 0.0 /100 | #311 | Tragic 8.1% |
| Dutch West Indians | 0.0 /100 | #312 | Tragic 8.2% |
| Immigrants | St. Vincent and the Grenadines | 0.0 /100 | #313 | Tragic 8.4% |
| Immigrants | Dominica | 0.0 /100 | #314 | Tragic 8.4% |
| British West Indians | 0.0 /100 | #315 | Tragic 8.4% |
| Immigrants | Grenada | 0.0 /100 | #316 | Tragic 8.4% |
| Immigrants | Guyana | 0.0 /100 | #317 | Tragic 8.5% |
| Guyanese | 0.0 /100 | #318 | Tragic 8.5% |
| Immigrants | Armenia | 0.0 /100 | #319 | Tragic 8.5% |
| Blacks/African Americans | 0.0 /100 | #320 | Tragic 8.6% |
| Immigrants | Dominican Republic | 0.0 /100 | #321 | Tragic 8.6% |
Demographics Similar to Immigrants from Lithuania by Unemployment Among Ages 25 to 29 years
In terms of unemployment among ages 25 to 29 years, the demographic groups most similar to Immigrants from Lithuania are Latvian (6.2%, a difference of 0.020%), Immigrants from Australia (6.2%, a difference of 0.030%), Venezuelan (6.2%, a difference of 0.080%), German Russian (6.2%, a difference of 0.10%), and Soviet Union (6.2%, a difference of 0.16%).
| Demographics | Rating | Rank | Unemployment Among Ages 25 to 29 years |
| Indonesians | 99.3 /100 | #39 | Exceptional 6.1% |
| Immigrants | Kenya | 99.3 /100 | #40 | Exceptional 6.1% |
| Fijians | 99.3 /100 | #41 | Exceptional 6.1% |
| Jordanians | 99.3 /100 | #42 | Exceptional 6.1% |
| Czechs | 99.2 /100 | #43 | Exceptional 6.2% |
| Mongolians | 99.2 /100 | #44 | Exceptional 6.2% |
| Venezuelans | 99.1 /100 | #45 | Exceptional 6.2% |
| Immigrants | Lithuania | 99.0 /100 | #46 | Exceptional 6.2% |
| Latvians | 99.0 /100 | #47 | Exceptional 6.2% |
| Immigrants | Australia | 99.0 /100 | #48 | Exceptional 6.2% |
| German Russians | 99.0 /100 | #49 | Exceptional 6.2% |
| Soviet Union | 98.9 /100 | #50 | Exceptional 6.2% |
| Burmese | 98.9 /100 | #51 | Exceptional 6.2% |
| Immigrants | Turkey | 98.9 /100 | #52 | Exceptional 6.2% |
| Turks | 98.8 /100 | #53 | Exceptional 6.2% |