Spaniard vs Bangladeshi Unemployment Among Youth under 25 years
COMPARE
Spaniard
Bangladeshi
Unemployment Among Youth under 25 years
Unemployment Among Youth under 25 years Comparison
Spaniards
Bangladeshis
11.7%
UNEMPLOYMENT AMONG YOUTH UNDER 25 YEARS
39.8/ 100
METRIC RATING
180th/ 347
METRIC RANK
11.6%
UNEMPLOYMENT AMONG YOUTH UNDER 25 YEARS
55.6/ 100
METRIC RATING
171st/ 347
METRIC RANK
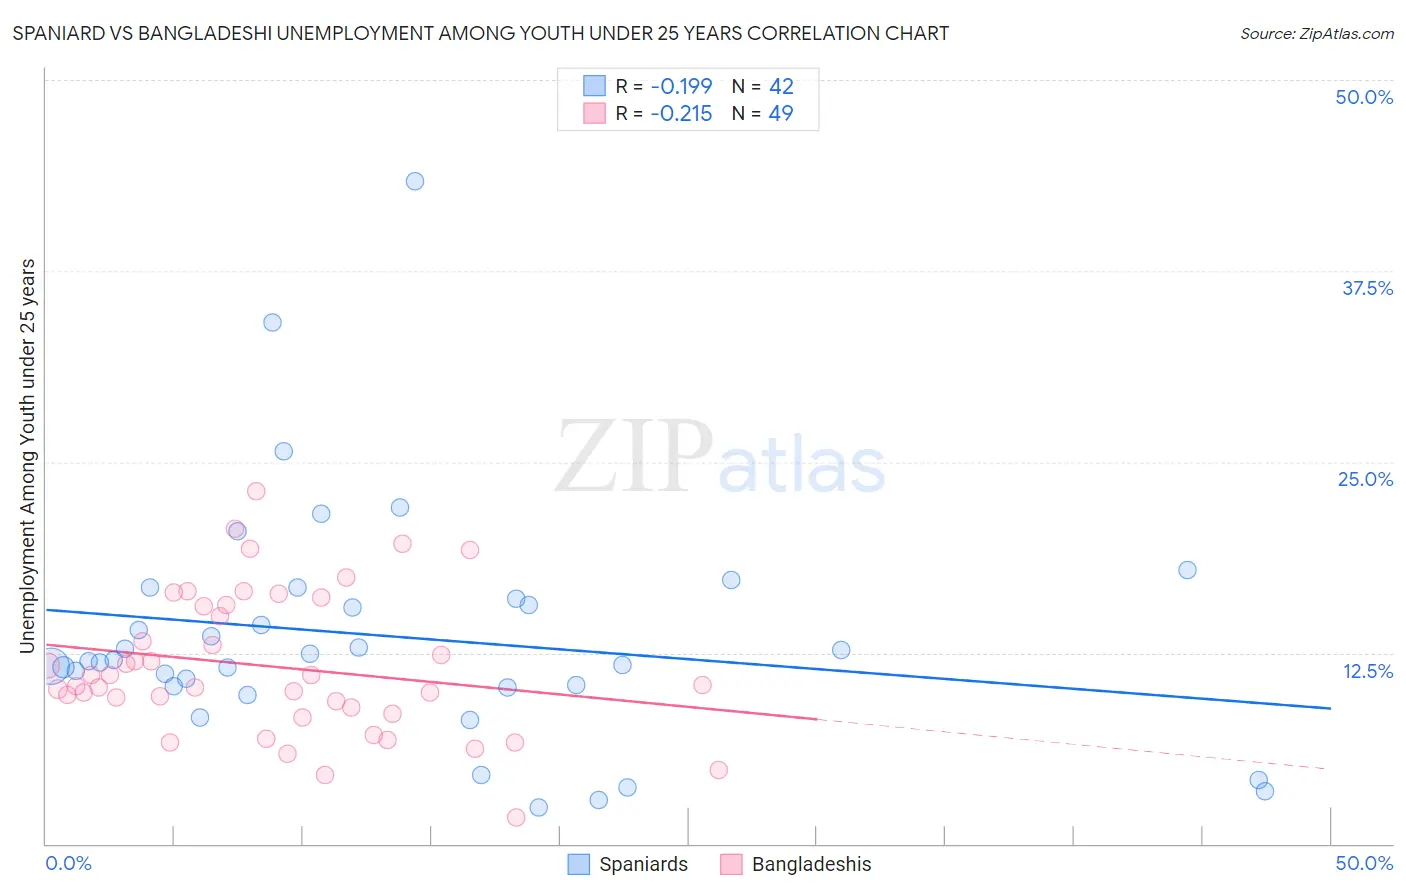
Spaniard vs Bangladeshi Unemployment Among Youth under 25 years Correlation Chart
The statistical analysis conducted on geographies consisting of 436,438,930 people shows a poor negative correlation between the proportion of Spaniards and unemployment rate among youth under the age of 25 in the United States with a correlation coefficient (R) of -0.199 and weighted average of 11.7%. Similarly, the statistical analysis conducted on geographies consisting of 140,831,540 people shows a weak negative correlation between the proportion of Bangladeshis and unemployment rate among youth under the age of 25 in the United States with a correlation coefficient (R) of -0.215 and weighted average of 11.6%, a difference of 0.66%.
Unemployment Among Youth under 25 years Correlation Summary
| Measurement | Spaniard | Bangladeshi |
| Minimum | 2.4% | 1.7% |
| Maximum | 43.4% | 23.1% |
| Range | 41.0% | 21.4% |
| Mean | 13.6% | 11.6% |
| Median | 12.0% | 10.4% |
| Interquartile 25% (IQ1) | 10.3% | 8.7% |
| Interquartile 75% (IQ3) | 16.1% | 15.6% |
| Interquartile Range (IQR) | 5.8% | 6.9% |
| Standard Deviation (Sample) | 7.8% | 4.6% |
| Standard Deviation (Population) | 7.7% | 4.6% |
Demographics Similar to Spaniards and Bangladeshis by Unemployment Among Youth under 25 years
In terms of unemployment among youth under 25 years, the demographic groups most similar to Spaniards are Syrian (11.7%, a difference of 0.060%), Immigrants from Europe (11.6%, a difference of 0.11%), Immigrants from Hong Kong (11.6%, a difference of 0.11%), Immigrants from Italy (11.7%, a difference of 0.16%), and Immigrants from Denmark (11.6%, a difference of 0.22%). Similarly, the demographic groups most similar to Bangladeshis are Immigrants from Morocco (11.6%, a difference of 0.020%), Russian (11.6%, a difference of 0.070%), Eastern European (11.6%, a difference of 0.080%), Potawatomi (11.6%, a difference of 0.10%), and Okinawan (11.6%, a difference of 0.13%).
| Demographics | Rating | Rank | Unemployment Among Youth under 25 years |
| Immigrants | Sweden | 61.3 /100 | #165 | Good 11.5% |
| Spanish | 60.3 /100 | #166 | Good 11.6% |
| Okinawans | 58.7 /100 | #167 | Average 11.6% |
| Potawatomi | 57.9 /100 | #168 | Average 11.6% |
| Eastern Europeans | 57.5 /100 | #169 | Average 11.6% |
| Russians | 57.3 /100 | #170 | Average 11.6% |
| Bangladeshis | 55.6 /100 | #171 | Average 11.6% |
| Immigrants | Morocco | 55.1 /100 | #172 | Average 11.6% |
| Immigrants | South Eastern Asia | 51.7 /100 | #173 | Average 11.6% |
| Immigrants | China | 50.0 /100 | #174 | Average 11.6% |
| Immigrants | Iraq | 47.0 /100 | #175 | Average 11.6% |
| Ugandans | 45.6 /100 | #176 | Average 11.6% |
| Immigrants | Denmark | 45.0 /100 | #177 | Average 11.6% |
| Immigrants | Europe | 42.4 /100 | #178 | Average 11.6% |
| Immigrants | Hong Kong | 42.4 /100 | #179 | Average 11.6% |
| Spaniards | 39.8 /100 | #180 | Fair 11.7% |
| Syrians | 38.4 /100 | #181 | Fair 11.7% |
| Immigrants | Italy | 36.2 /100 | #182 | Fair 11.7% |
| Americans | 34.5 /100 | #183 | Fair 11.7% |
| Immigrants | Eastern Europe | 34.1 /100 | #184 | Fair 11.7% |
| French American Indians | 34.0 /100 | #185 | Fair 11.7% |