Immigrants from Dominica vs Alsatian Unemployment Among Youth under 25 years
COMPARE
Immigrants from Dominica
Alsatian
Unemployment Among Youth under 25 years
Unemployment Among Youth under 25 years Comparison
Immigrants from Dominica
Alsatians
14.6%
UNEMPLOYMENT AMONG YOUTH UNDER 25 YEARS
0.0/ 100
METRIC RATING
318th/ 347
METRIC RANK
11.9%
UNEMPLOYMENT AMONG YOUTH UNDER 25 YEARS
6.1/ 100
METRIC RATING
220th/ 347
METRIC RANK
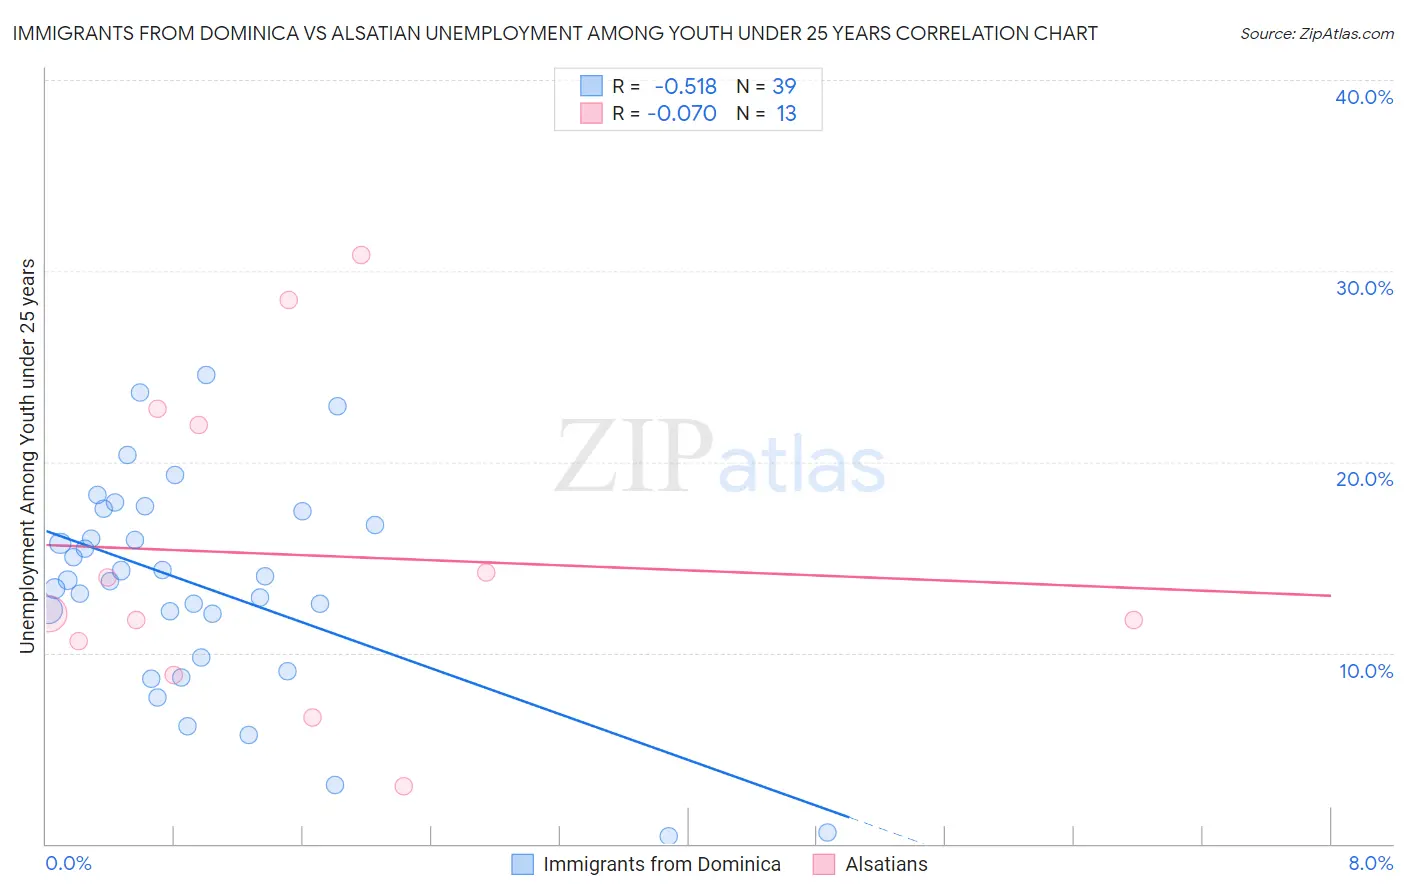
Immigrants from Dominica vs Alsatian Unemployment Among Youth under 25 years Correlation Chart
The statistical analysis conducted on geographies consisting of 83,611,163 people shows a substantial negative correlation between the proportion of Immigrants from Dominica and unemployment rate among youth under the age of 25 in the United States with a correlation coefficient (R) of -0.518 and weighted average of 14.6%. Similarly, the statistical analysis conducted on geographies consisting of 82,312,882 people shows a slight negative correlation between the proportion of Alsatians and unemployment rate among youth under the age of 25 in the United States with a correlation coefficient (R) of -0.070 and weighted average of 11.9%, a difference of 22.2%.
Unemployment Among Youth under 25 years Correlation Summary
| Measurement | Immigrants from Dominica | Alsatian |
| Minimum | 0.40% | 3.0% |
| Maximum | 24.6% | 30.8% |
| Range | 24.2% | 27.8% |
| Mean | 13.5% | 15.1% |
| Median | 13.8% | 12.0% |
| Interquartile 25% (IQ1) | 9.8% | 9.7% |
| Interquartile 75% (IQ3) | 17.4% | 22.4% |
| Interquartile Range (IQR) | 7.7% | 12.6% |
| Standard Deviation (Sample) | 5.6% | 8.4% |
| Standard Deviation (Population) | 5.6% | 8.1% |
Similar Demographics by Unemployment Among Youth under 25 years
Demographics Similar to Immigrants from Dominica by Unemployment Among Youth under 25 years
In terms of unemployment among youth under 25 years, the demographic groups most similar to Immigrants from Dominica are West Indian (14.6%, a difference of 0.040%), Barbadian (14.6%, a difference of 0.080%), Cheyenne (14.6%, a difference of 0.24%), Trinidadian and Tobagonian (14.6%, a difference of 0.31%), and Immigrants from Trinidad and Tobago (14.6%, a difference of 0.40%).
| Demographics | Rating | Rank | Unemployment Among Youth under 25 years |
| Immigrants | Bangladesh | 0.0 /100 | #311 | Tragic 14.2% |
| Vietnamese | 0.0 /100 | #312 | Tragic 14.3% |
| Immigrants | Armenia | 0.0 /100 | #313 | Tragic 14.4% |
| Jamaicans | 0.0 /100 | #314 | Tragic 14.4% |
| Sioux | 0.0 /100 | #315 | Tragic 14.4% |
| Natives/Alaskans | 0.0 /100 | #316 | Tragic 14.5% |
| Blacks/African Americans | 0.0 /100 | #317 | Tragic 14.5% |
| Immigrants | Dominica | 0.0 /100 | #318 | Tragic 14.6% |
| West Indians | 0.0 /100 | #319 | Tragic 14.6% |
| Barbadians | 0.0 /100 | #320 | Tragic 14.6% |
| Cheyenne | 0.0 /100 | #321 | Tragic 14.6% |
| Trinidadians and Tobagonians | 0.0 /100 | #322 | Tragic 14.6% |
| Immigrants | Trinidad and Tobago | 0.0 /100 | #323 | Tragic 14.6% |
| Immigrants | Jamaica | 0.0 /100 | #324 | Tragic 14.8% |
| Alaska Natives | 0.0 /100 | #325 | Tragic 14.9% |
Demographics Similar to Alsatians by Unemployment Among Youth under 25 years
In terms of unemployment among youth under 25 years, the demographic groups most similar to Alsatians are Nonimmigrants (11.9%, a difference of 0.020%), Immigrants from Middle Africa (11.9%, a difference of 0.13%), Yaqui (11.9%, a difference of 0.14%), Guamanian/Chamorro (11.9%, a difference of 0.15%), and Samoan (11.9%, a difference of 0.21%).
| Demographics | Rating | Rank | Unemployment Among Youth under 25 years |
| South Americans | 8.5 /100 | #213 | Tragic 11.9% |
| Costa Ricans | 8.2 /100 | #214 | Tragic 11.9% |
| Samoans | 7.4 /100 | #215 | Tragic 11.9% |
| Guamanians/Chamorros | 7.0 /100 | #216 | Tragic 11.9% |
| Yaqui | 6.9 /100 | #217 | Tragic 11.9% |
| Immigrants | Middle Africa | 6.8 /100 | #218 | Tragic 11.9% |
| Immigrants | Nonimmigrants | 6.2 /100 | #219 | Tragic 11.9% |
| Alsatians | 6.1 /100 | #220 | Tragic 11.9% |
| Immigrants | Portugal | 4.9 /100 | #221 | Tragic 12.0% |
| Israelis | 4.1 /100 | #222 | Tragic 12.0% |
| Immigrants | Ireland | 3.5 /100 | #223 | Tragic 12.0% |
| Hawaiians | 3.5 /100 | #224 | Tragic 12.0% |
| Immigrants | Ukraine | 3.0 /100 | #225 | Tragic 12.0% |
| Immigrants | Israel | 2.6 /100 | #226 | Tragic 12.0% |
| Immigrants | Iran | 2.6 /100 | #227 | Tragic 12.0% |