Immigrants from Czechoslovakia vs Black/African American Unemployment Among Youth under 25 years
COMPARE
Immigrants from Czechoslovakia
Black/African American
Unemployment Among Youth under 25 years
Unemployment Among Youth under 25 years Comparison
Immigrants from Czechoslovakia
Blacks/African Americans
11.5%
UNEMPLOYMENT AMONG YOUTH UNDER 25 YEARS
67.1/ 100
METRIC RATING
153rd/ 347
METRIC RANK
14.5%
UNEMPLOYMENT AMONG YOUTH UNDER 25 YEARS
0.0/ 100
METRIC RATING
317th/ 347
METRIC RANK
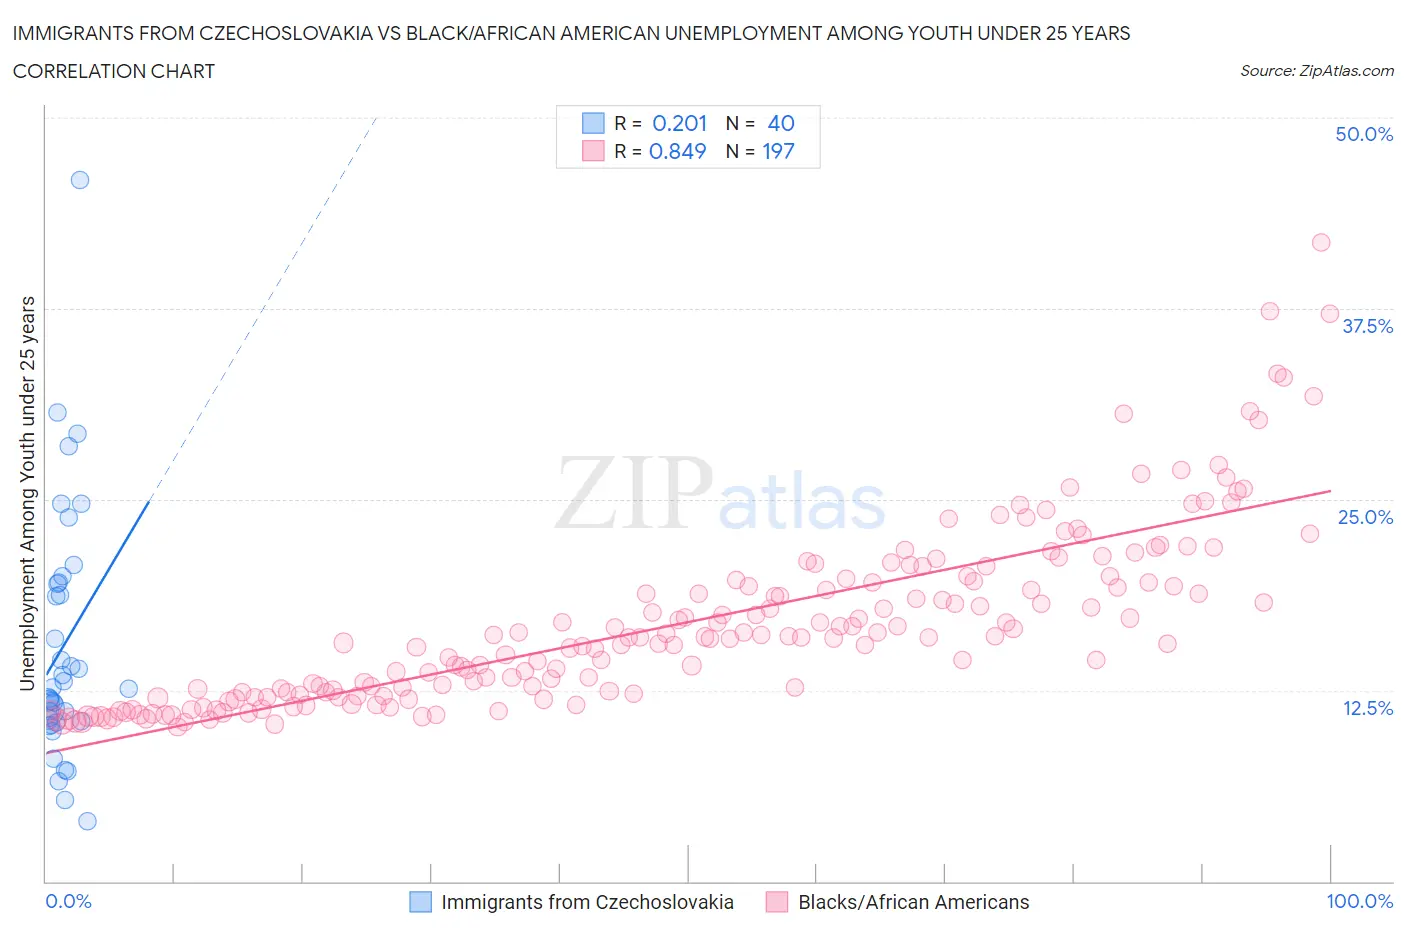
Immigrants from Czechoslovakia vs Black/African American Unemployment Among Youth under 25 years Correlation Chart
The statistical analysis conducted on geographies consisting of 194,232,331 people shows a weak positive correlation between the proportion of Immigrants from Czechoslovakia and unemployment rate among youth under the age of 25 in the United States with a correlation coefficient (R) of 0.201 and weighted average of 11.5%. Similarly, the statistical analysis conducted on geographies consisting of 545,283,249 people shows a very strong positive correlation between the proportion of Blacks/African Americans and unemployment rate among youth under the age of 25 in the United States with a correlation coefficient (R) of 0.849 and weighted average of 14.5%, a difference of 25.7%.
Unemployment Among Youth under 25 years Correlation Summary
| Measurement | Immigrants from Czechoslovakia | Black/African American |
| Minimum | 3.9% | 10.1% |
| Maximum | 45.9% | 41.8% |
| Range | 42.0% | 31.7% |
| Mean | 15.4% | 16.9% |
| Median | 12.7% | 15.9% |
| Interquartile 25% (IQ1) | 10.4% | 12.2% |
| Interquartile 75% (IQ3) | 19.5% | 19.6% |
| Interquartile Range (IQR) | 9.1% | 7.4% |
| Standard Deviation (Sample) | 8.3% | 5.8% |
| Standard Deviation (Population) | 8.2% | 5.8% |
Similar Demographics by Unemployment Among Youth under 25 years
Demographics Similar to Immigrants from Czechoslovakia by Unemployment Among Youth under 25 years
In terms of unemployment among youth under 25 years, the demographic groups most similar to Immigrants from Czechoslovakia are Immigrants from Asia (11.5%, a difference of 0.020%), Immigrants from Romania (11.5%, a difference of 0.040%), Iraqi (11.5%, a difference of 0.060%), Immigrants from Germany (11.5%, a difference of 0.060%), and Indian (Asian) (11.5%, a difference of 0.090%).
| Demographics | Rating | Rank | Unemployment Among Youth under 25 years |
| Brazilians | 72.5 /100 | #146 | Good 11.5% |
| Laotians | 72.4 /100 | #147 | Good 11.5% |
| Immigrants | Northern Europe | 72.1 /100 | #148 | Good 11.5% |
| Immigrants | Cambodia | 71.8 /100 | #149 | Good 11.5% |
| Immigrants | Switzerland | 71.6 /100 | #150 | Good 11.5% |
| Uruguayans | 70.4 /100 | #151 | Good 11.5% |
| Iraqis | 68.3 /100 | #152 | Good 11.5% |
| Immigrants | Czechoslovakia | 67.1 /100 | #153 | Good 11.5% |
| Immigrants | Asia | 66.7 /100 | #154 | Good 11.5% |
| Immigrants | Romania | 66.3 /100 | #155 | Good 11.5% |
| Immigrants | Germany | 65.9 /100 | #156 | Good 11.5% |
| Indians (Asian) | 65.1 /100 | #157 | Good 11.5% |
| Immigrants | Turkey | 64.8 /100 | #158 | Good 11.5% |
| Immigrants | Western Europe | 64.7 /100 | #159 | Good 11.5% |
| Immigrants | Eastern Asia | 64.5 /100 | #160 | Good 11.5% |
Demographics Similar to Blacks/African Americans by Unemployment Among Youth under 25 years
In terms of unemployment among youth under 25 years, the demographic groups most similar to Blacks/African Americans are Native/Alaskan (14.5%, a difference of 0.090%), Sioux (14.4%, a difference of 0.51%), Jamaican (14.4%, a difference of 0.63%), Immigrants from Armenia (14.4%, a difference of 0.71%), and Immigrants from Dominica (14.6%, a difference of 0.72%).
| Demographics | Rating | Rank | Unemployment Among Youth under 25 years |
| Immigrants | West Indies | 0.0 /100 | #310 | Tragic 14.2% |
| Immigrants | Bangladesh | 0.0 /100 | #311 | Tragic 14.2% |
| Vietnamese | 0.0 /100 | #312 | Tragic 14.3% |
| Immigrants | Armenia | 0.0 /100 | #313 | Tragic 14.4% |
| Jamaicans | 0.0 /100 | #314 | Tragic 14.4% |
| Sioux | 0.0 /100 | #315 | Tragic 14.4% |
| Natives/Alaskans | 0.0 /100 | #316 | Tragic 14.5% |
| Blacks/African Americans | 0.0 /100 | #317 | Tragic 14.5% |
| Immigrants | Dominica | 0.0 /100 | #318 | Tragic 14.6% |
| West Indians | 0.0 /100 | #319 | Tragic 14.6% |
| Barbadians | 0.0 /100 | #320 | Tragic 14.6% |
| Cheyenne | 0.0 /100 | #321 | Tragic 14.6% |
| Trinidadians and Tobagonians | 0.0 /100 | #322 | Tragic 14.6% |
| Immigrants | Trinidad and Tobago | 0.0 /100 | #323 | Tragic 14.6% |
| Immigrants | Jamaica | 0.0 /100 | #324 | Tragic 14.8% |