Immigrants from Czechoslovakia vs Immigrants from Russia Unemployment Among Youth under 25 years
COMPARE
Immigrants from Czechoslovakia
Immigrants from Russia
Unemployment Among Youth under 25 years
Unemployment Among Youth under 25 years Comparison
Immigrants from Czechoslovakia
Immigrants from Russia
11.5%
UNEMPLOYMENT AMONG YOUTH UNDER 25 YEARS
67.1/ 100
METRIC RATING
153rd/ 347
METRIC RANK
11.7%
UNEMPLOYMENT AMONG YOUTH UNDER 25 YEARS
28.5/ 100
METRIC RATING
192nd/ 347
METRIC RANK
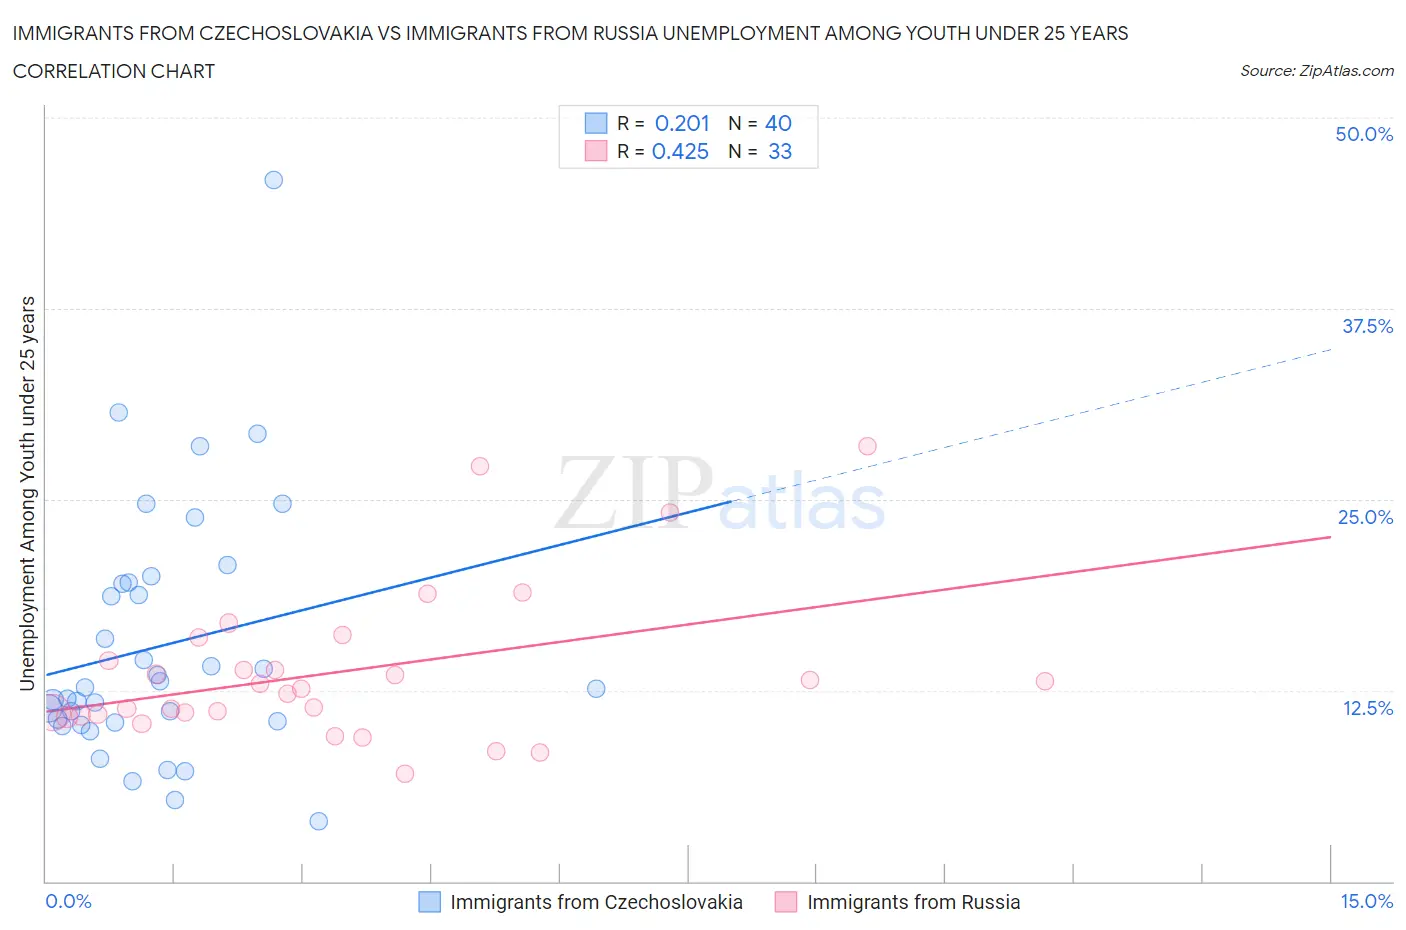
Immigrants from Czechoslovakia vs Immigrants from Russia Unemployment Among Youth under 25 years Correlation Chart
The statistical analysis conducted on geographies consisting of 194,232,331 people shows a weak positive correlation between the proportion of Immigrants from Czechoslovakia and unemployment rate among youth under the age of 25 in the United States with a correlation coefficient (R) of 0.201 and weighted average of 11.5%. Similarly, the statistical analysis conducted on geographies consisting of 344,363,065 people shows a moderate positive correlation between the proportion of Immigrants from Russia and unemployment rate among youth under the age of 25 in the United States with a correlation coefficient (R) of 0.425 and weighted average of 11.7%, a difference of 1.7%.
Unemployment Among Youth under 25 years Correlation Summary
| Measurement | Immigrants from Czechoslovakia | Immigrants from Russia |
| Minimum | 3.9% | 7.0% |
| Maximum | 45.9% | 28.5% |
| Range | 42.0% | 21.5% |
| Mean | 15.4% | 13.7% |
| Median | 12.7% | 12.6% |
| Interquartile 25% (IQ1) | 10.4% | 10.9% |
| Interquartile 75% (IQ3) | 19.5% | 15.2% |
| Interquartile Range (IQR) | 9.1% | 4.3% |
| Standard Deviation (Sample) | 8.3% | 5.0% |
| Standard Deviation (Population) | 8.2% | 4.9% |
Similar Demographics by Unemployment Among Youth under 25 years
Demographics Similar to Immigrants from Czechoslovakia by Unemployment Among Youth under 25 years
In terms of unemployment among youth under 25 years, the demographic groups most similar to Immigrants from Czechoslovakia are Immigrants from Asia (11.5%, a difference of 0.020%), Immigrants from Romania (11.5%, a difference of 0.040%), Iraqi (11.5%, a difference of 0.060%), Immigrants from Germany (11.5%, a difference of 0.060%), and Indian (Asian) (11.5%, a difference of 0.090%).
| Demographics | Rating | Rank | Unemployment Among Youth under 25 years |
| Brazilians | 72.5 /100 | #146 | Good 11.5% |
| Laotians | 72.4 /100 | #147 | Good 11.5% |
| Immigrants | Northern Europe | 72.1 /100 | #148 | Good 11.5% |
| Immigrants | Cambodia | 71.8 /100 | #149 | Good 11.5% |
| Immigrants | Switzerland | 71.6 /100 | #150 | Good 11.5% |
| Uruguayans | 70.4 /100 | #151 | Good 11.5% |
| Iraqis | 68.3 /100 | #152 | Good 11.5% |
| Immigrants | Czechoslovakia | 67.1 /100 | #153 | Good 11.5% |
| Immigrants | Asia | 66.7 /100 | #154 | Good 11.5% |
| Immigrants | Romania | 66.3 /100 | #155 | Good 11.5% |
| Immigrants | Germany | 65.9 /100 | #156 | Good 11.5% |
| Indians (Asian) | 65.1 /100 | #157 | Good 11.5% |
| Immigrants | Turkey | 64.8 /100 | #158 | Good 11.5% |
| Immigrants | Western Europe | 64.7 /100 | #159 | Good 11.5% |
| Immigrants | Eastern Asia | 64.5 /100 | #160 | Good 11.5% |
Demographics Similar to Immigrants from Russia by Unemployment Among Youth under 25 years
In terms of unemployment among youth under 25 years, the demographic groups most similar to Immigrants from Russia are Cypriot (11.7%, a difference of 0.0%), Seminole (11.7%, a difference of 0.030%), Immigrants from Sri Lanka (11.7%, a difference of 0.030%), Paraguayan (11.7%, a difference of 0.070%), and Egyptian (11.7%, a difference of 0.080%).
| Demographics | Rating | Rank | Unemployment Among Youth under 25 years |
| French American Indians | 34.0 /100 | #185 | Fair 11.7% |
| Maltese | 33.9 /100 | #186 | Fair 11.7% |
| Immigrants | Egypt | 31.9 /100 | #187 | Fair 11.7% |
| Immigrants | Poland | 31.4 /100 | #188 | Fair 11.7% |
| Japanese | 30.8 /100 | #189 | Fair 11.7% |
| Portuguese | 30.3 /100 | #190 | Fair 11.7% |
| Cypriots | 28.5 /100 | #191 | Fair 11.7% |
| Immigrants | Russia | 28.5 /100 | #192 | Fair 11.7% |
| Seminole | 27.9 /100 | #193 | Fair 11.7% |
| Immigrants | Sri Lanka | 27.8 /100 | #194 | Fair 11.7% |
| Paraguayans | 27.2 /100 | #195 | Fair 11.7% |
| Egyptians | 26.9 /100 | #196 | Fair 11.7% |
| Koreans | 23.9 /100 | #197 | Fair 11.7% |
| Cherokee | 21.2 /100 | #198 | Fair 11.8% |
| Immigrants | Colombia | 20.9 /100 | #199 | Fair 11.8% |