Immigrants from Czechoslovakia vs Immigrants from India Unemployment Among Ages 35 to 44 years
COMPARE
Immigrants from Czechoslovakia
Immigrants from India
Unemployment Among Ages 35 to 44 years
Unemployment Among Ages 35 to 44 years Comparison
Immigrants from Czechoslovakia
Immigrants from India
4.5%
UNEMPLOYMENT AMONG AGES 35 TO 44 YEARS
89.2/ 100
METRIC RATING
112th/ 347
METRIC RANK
3.8%
UNEMPLOYMENT AMONG AGES 35 TO 44 YEARS
100.0/ 100
METRIC RATING
1st/ 347
METRIC RANK
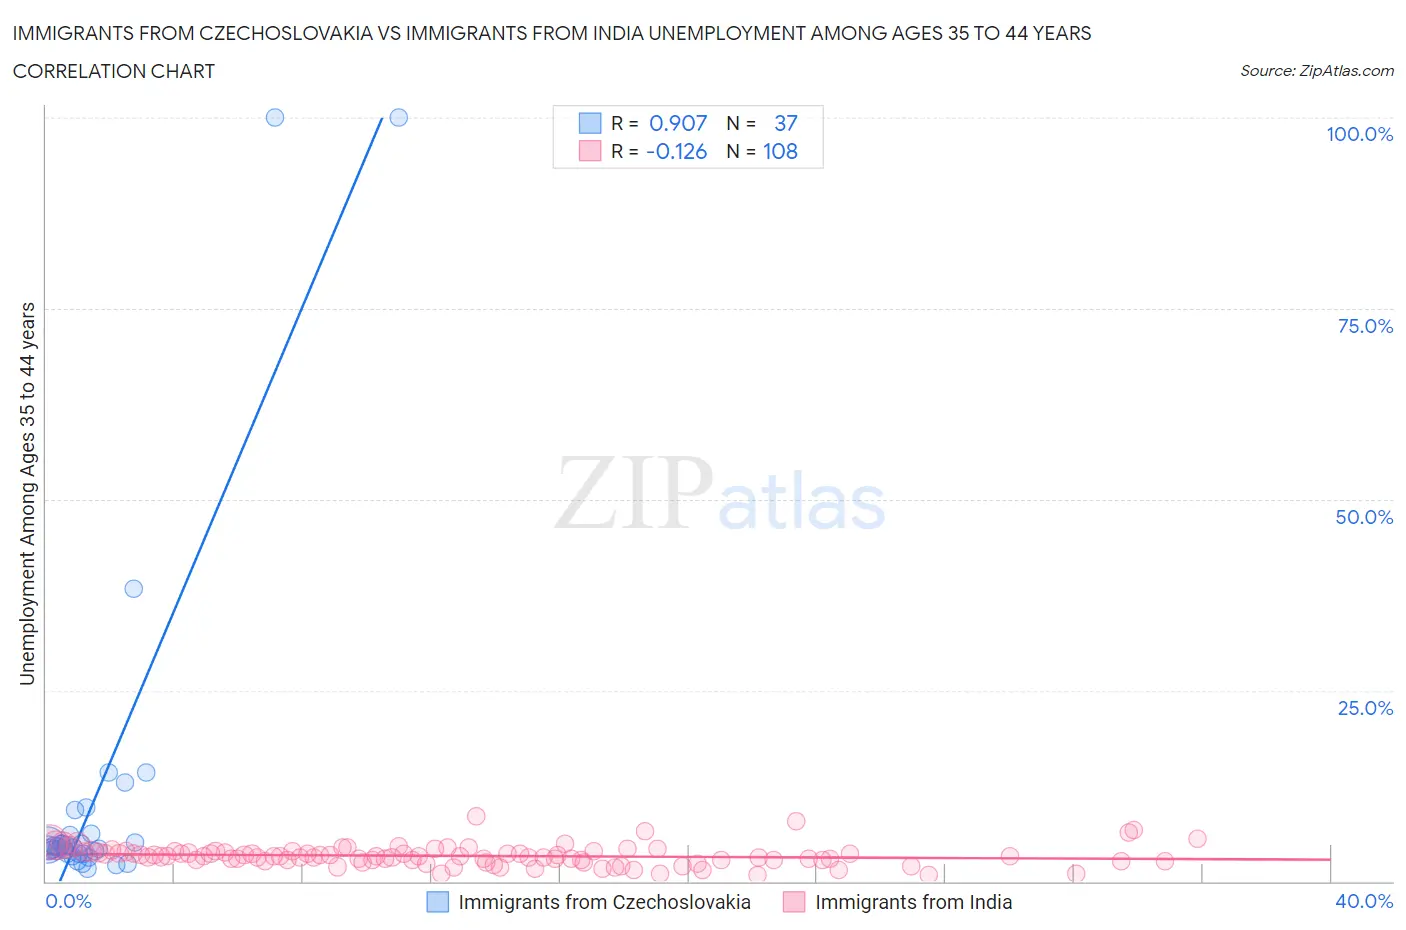
Immigrants from Czechoslovakia vs Immigrants from India Unemployment Among Ages 35 to 44 years Correlation Chart
The statistical analysis conducted on geographies consisting of 193,308,245 people shows a near-perfect positive correlation between the proportion of Immigrants from Czechoslovakia and unemployment rate among population between the ages 35 and 44 in the United States with a correlation coefficient (R) of 0.907 and weighted average of 4.5%. Similarly, the statistical analysis conducted on geographies consisting of 422,780,739 people shows a poor negative correlation between the proportion of Immigrants from India and unemployment rate among population between the ages 35 and 44 in the United States with a correlation coefficient (R) of -0.126 and weighted average of 3.8%, a difference of 20.1%.
Unemployment Among Ages 35 to 44 years Correlation Summary
| Measurement | Immigrants from Czechoslovakia | Immigrants from India |
| Minimum | 1.7% | 0.90% |
| Maximum | 100.0% | 8.5% |
| Range | 98.3% | 7.6% |
| Mean | 11.2% | 3.3% |
| Median | 4.4% | 3.2% |
| Interquartile 25% (IQ1) | 3.6% | 2.7% |
| Interquartile 75% (IQ3) | 6.2% | 3.9% |
| Interquartile Range (IQR) | 2.6% | 1.1% |
| Standard Deviation (Sample) | 22.4% | 1.3% |
| Standard Deviation (Population) | 22.1% | 1.3% |
Similar Demographics by Unemployment Among Ages 35 to 44 years
Demographics Similar to Immigrants from Czechoslovakia by Unemployment Among Ages 35 to 44 years
In terms of unemployment among ages 35 to 44 years, the demographic groups most similar to Immigrants from Czechoslovakia are Immigrants from Nicaragua (4.5%, a difference of 0.13%), Immigrants from Italy (4.5%, a difference of 0.15%), Immigrants from Kazakhstan (4.5%, a difference of 0.16%), Macedonian (4.5%, a difference of 0.17%), and Maltese (4.5%, a difference of 0.19%).
| Demographics | Rating | Rank | Unemployment Among Ages 35 to 44 years |
| Immigrants | Saudi Arabia | 91.3 /100 | #105 | Exceptional 4.5% |
| Immigrants | North America | 91.1 /100 | #106 | Exceptional 4.5% |
| Immigrants | North Macedonia | 90.7 /100 | #107 | Exceptional 4.5% |
| New Zealanders | 90.3 /100 | #108 | Exceptional 4.5% |
| Romanians | 90.3 /100 | #109 | Exceptional 4.5% |
| Immigrants | Kazakhstan | 90.0 /100 | #110 | Excellent 4.5% |
| Immigrants | Nicaragua | 89.8 /100 | #111 | Excellent 4.5% |
| Immigrants | Czechoslovakia | 89.2 /100 | #112 | Excellent 4.5% |
| Immigrants | Italy | 88.4 /100 | #113 | Excellent 4.5% |
| Macedonians | 88.3 /100 | #114 | Excellent 4.5% |
| Maltese | 88.1 /100 | #115 | Excellent 4.5% |
| Immigrants | Israel | 88.1 /100 | #116 | Excellent 4.5% |
| Immigrants | Greece | 87.9 /100 | #117 | Excellent 4.5% |
| Irish | 87.9 /100 | #118 | Excellent 4.5% |
| Nicaraguans | 87.6 /100 | #119 | Excellent 4.5% |
Demographics Similar to Immigrants from India by Unemployment Among Ages 35 to 44 years
In terms of unemployment among ages 35 to 44 years, the demographic groups most similar to Immigrants from India are Thai (3.9%, a difference of 4.8%), Norwegian (4.0%, a difference of 6.3%), Immigrants from Taiwan (4.0%, a difference of 6.9%), Filipino (4.0%, a difference of 7.6%), and Immigrants from Venezuela (4.0%, a difference of 7.7%).
| Demographics | Rating | Rank | Unemployment Among Ages 35 to 44 years |
| Immigrants | India | 100.0 /100 | #1 | Exceptional 3.8% |
| Thais | 100.0 /100 | #2 | Exceptional 3.9% |
| Norwegians | 100.0 /100 | #3 | Exceptional 4.0% |
| Immigrants | Taiwan | 100.0 /100 | #4 | Exceptional 4.0% |
| Filipinos | 100.0 /100 | #5 | Exceptional 4.0% |
| Immigrants | Venezuela | 100.0 /100 | #6 | Exceptional 4.0% |
| Immigrants | Cuba | 99.9 /100 | #7 | Exceptional 4.1% |
| Immigrants | South Central Asia | 99.9 /100 | #8 | Exceptional 4.1% |
| Danes | 99.9 /100 | #9 | Exceptional 4.1% |
| Immigrants | Singapore | 99.9 /100 | #10 | Exceptional 4.1% |
| Sudanese | 99.9 /100 | #11 | Exceptional 4.1% |
| Venezuelans | 99.9 /100 | #12 | Exceptional 4.1% |
| Bolivians | 99.9 /100 | #13 | Exceptional 4.1% |
| Czechs | 99.9 /100 | #14 | Exceptional 4.1% |
| Tongans | 99.8 /100 | #15 | Exceptional 4.2% |