Immigrants from Belize vs Scotch-Irish Unemployment Among Women with Children Under 18 years
COMPARE
Immigrants from Belize
Scotch-Irish
Unemployment Among Women with Children Under 18 years
Unemployment Among Women with Children Under 18 years Comparison
Immigrants from Belize
Scotch-Irish
6.7%
UNEMPLOYMENT AMONG WOMEN WITH CHILDREN UNDER 18 YEARS
0.0/ 100
METRIC RATING
320th/ 347
METRIC RANK
5.3%
UNEMPLOYMENT AMONG WOMEN WITH CHILDREN UNDER 18 YEARS
85.7/ 100
METRIC RATING
122nd/ 347
METRIC RANK
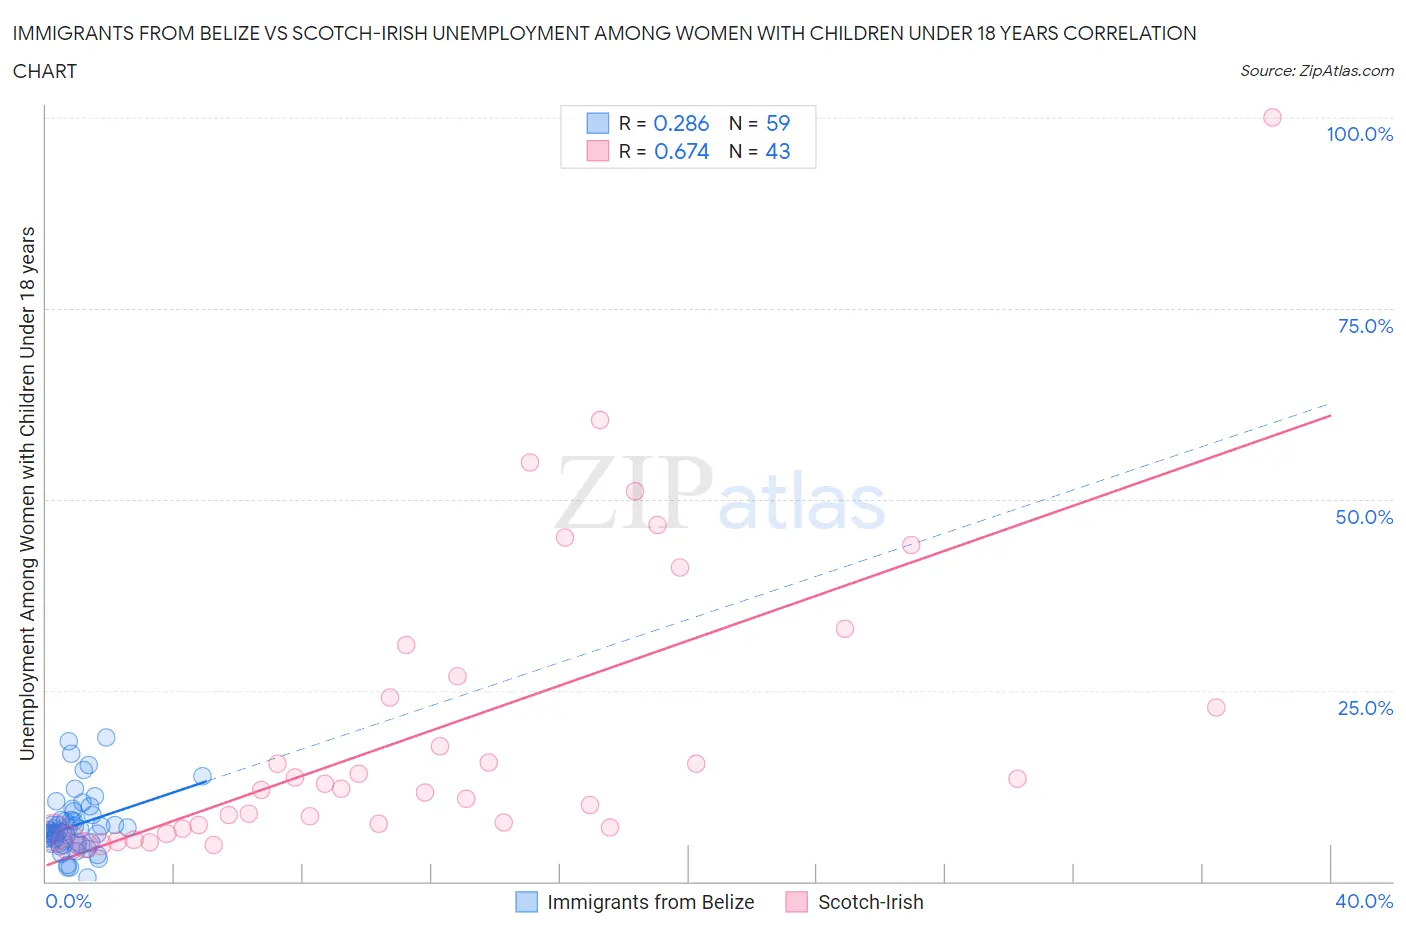
Immigrants from Belize vs Scotch-Irish Unemployment Among Women with Children Under 18 years Correlation Chart
The statistical analysis conducted on geographies consisting of 128,888,492 people shows a weak positive correlation between the proportion of Immigrants from Belize and unemployment rate among women with children under the age of 18 in the United States with a correlation coefficient (R) of 0.286 and weighted average of 6.7%. Similarly, the statistical analysis conducted on geographies consisting of 498,737,336 people shows a significant positive correlation between the proportion of Scotch-Irish and unemployment rate among women with children under the age of 18 in the United States with a correlation coefficient (R) of 0.674 and weighted average of 5.3%, a difference of 26.7%.
Unemployment Among Women with Children Under 18 years Correlation Summary
| Measurement | Immigrants from Belize | Scotch-Irish |
| Minimum | 0.50% | 4.7% |
| Maximum | 18.9% | 100.0% |
| Range | 18.4% | 95.3% |
| Mean | 7.3% | 20.1% |
| Median | 6.5% | 12.1% |
| Interquartile 25% (IQ1) | 4.9% | 7.0% |
| Interquartile 75% (IQ3) | 8.1% | 26.8% |
| Interquartile Range (IQR) | 3.2% | 19.8% |
| Standard Deviation (Sample) | 3.8% | 19.9% |
| Standard Deviation (Population) | 3.8% | 19.7% |
Similar Demographics by Unemployment Among Women with Children Under 18 years
Demographics Similar to Immigrants from Belize by Unemployment Among Women with Children Under 18 years
In terms of unemployment among women with children under 18 years, the demographic groups most similar to Immigrants from Belize are U.S. Virgin Islander (6.7%, a difference of 0.050%), Central American Indian (6.7%, a difference of 0.090%), Alaska Native (6.7%, a difference of 0.33%), Shoshone (6.6%, a difference of 0.62%), and Immigrants from Ecuador (6.6%, a difference of 0.66%).
| Demographics | Rating | Rank | Unemployment Among Women with Children Under 18 years |
| Hispanics or Latinos | 0.0 /100 | #313 | Tragic 6.6% |
| British West Indians | 0.0 /100 | #314 | Tragic 6.6% |
| Immigrants | West Indies | 0.0 /100 | #315 | Tragic 6.6% |
| Immigrants | Ecuador | 0.0 /100 | #316 | Tragic 6.6% |
| Shoshone | 0.0 /100 | #317 | Tragic 6.6% |
| Alaska Natives | 0.0 /100 | #318 | Tragic 6.7% |
| Central American Indians | 0.0 /100 | #319 | Tragic 6.7% |
| Immigrants | Belize | 0.0 /100 | #320 | Tragic 6.7% |
| U.S. Virgin Islanders | 0.0 /100 | #321 | Tragic 6.7% |
| Houma | 0.0 /100 | #322 | Tragic 6.8% |
| Pueblo | 0.0 /100 | #323 | Tragic 6.8% |
| Paiute | 0.0 /100 | #324 | Tragic 6.9% |
| Immigrants | Dominica | 0.0 /100 | #325 | Tragic 7.0% |
| Chippewa | 0.0 /100 | #326 | Tragic 7.0% |
| Lumbee | 0.0 /100 | #327 | Tragic 7.1% |
Demographics Similar to Scotch-Irish by Unemployment Among Women with Children Under 18 years
In terms of unemployment among women with children under 18 years, the demographic groups most similar to Scotch-Irish are Immigrants from Romania (5.3%, a difference of 0.010%), Egyptian (5.3%, a difference of 0.11%), Basque (5.3%, a difference of 0.13%), Immigrants from Europe (5.3%, a difference of 0.16%), and Sudanese (5.3%, a difference of 0.20%).
| Demographics | Rating | Rank | Unemployment Among Women with Children Under 18 years |
| Hungarians | 88.1 /100 | #115 | Excellent 5.3% |
| Macedonians | 87.7 /100 | #116 | Excellent 5.3% |
| Canadians | 87.4 /100 | #117 | Excellent 5.3% |
| Immigrants | Europe | 86.7 /100 | #118 | Excellent 5.3% |
| Basques | 86.5 /100 | #119 | Excellent 5.3% |
| Egyptians | 86.4 /100 | #120 | Excellent 5.3% |
| Immigrants | Romania | 85.8 /100 | #121 | Excellent 5.3% |
| Scotch-Irish | 85.7 /100 | #122 | Excellent 5.3% |
| Sudanese | 84.3 /100 | #123 | Excellent 5.3% |
| Native Hawaiians | 84.0 /100 | #124 | Excellent 5.3% |
| Immigrants | North Macedonia | 83.2 /100 | #125 | Excellent 5.3% |
| Immigrants | Oceania | 83.1 /100 | #126 | Excellent 5.3% |
| Whites/Caucasians | 82.9 /100 | #127 | Excellent 5.3% |
| Immigrants | South Africa | 82.8 /100 | #128 | Excellent 5.3% |
| Immigrants | Italy | 82.3 /100 | #129 | Excellent 5.3% |