Immigrants from Croatia vs Immigrants from India Unemployment Among Ages 20 to 24 years
COMPARE
Immigrants from Croatia
Immigrants from India
Unemployment Among Ages 20 to 24 years
Unemployment Among Ages 20 to 24 years Comparison
Immigrants from Croatia
Immigrants from India
9.9%
UNEMPLOYMENT AMONG AGES 20 TO 24 YEARS
99.0/ 100
METRIC RATING
70th/ 347
METRIC RANK
9.7%
UNEMPLOYMENT AMONG AGES 20 TO 24 YEARS
99.8/ 100
METRIC RATING
47th/ 347
METRIC RANK
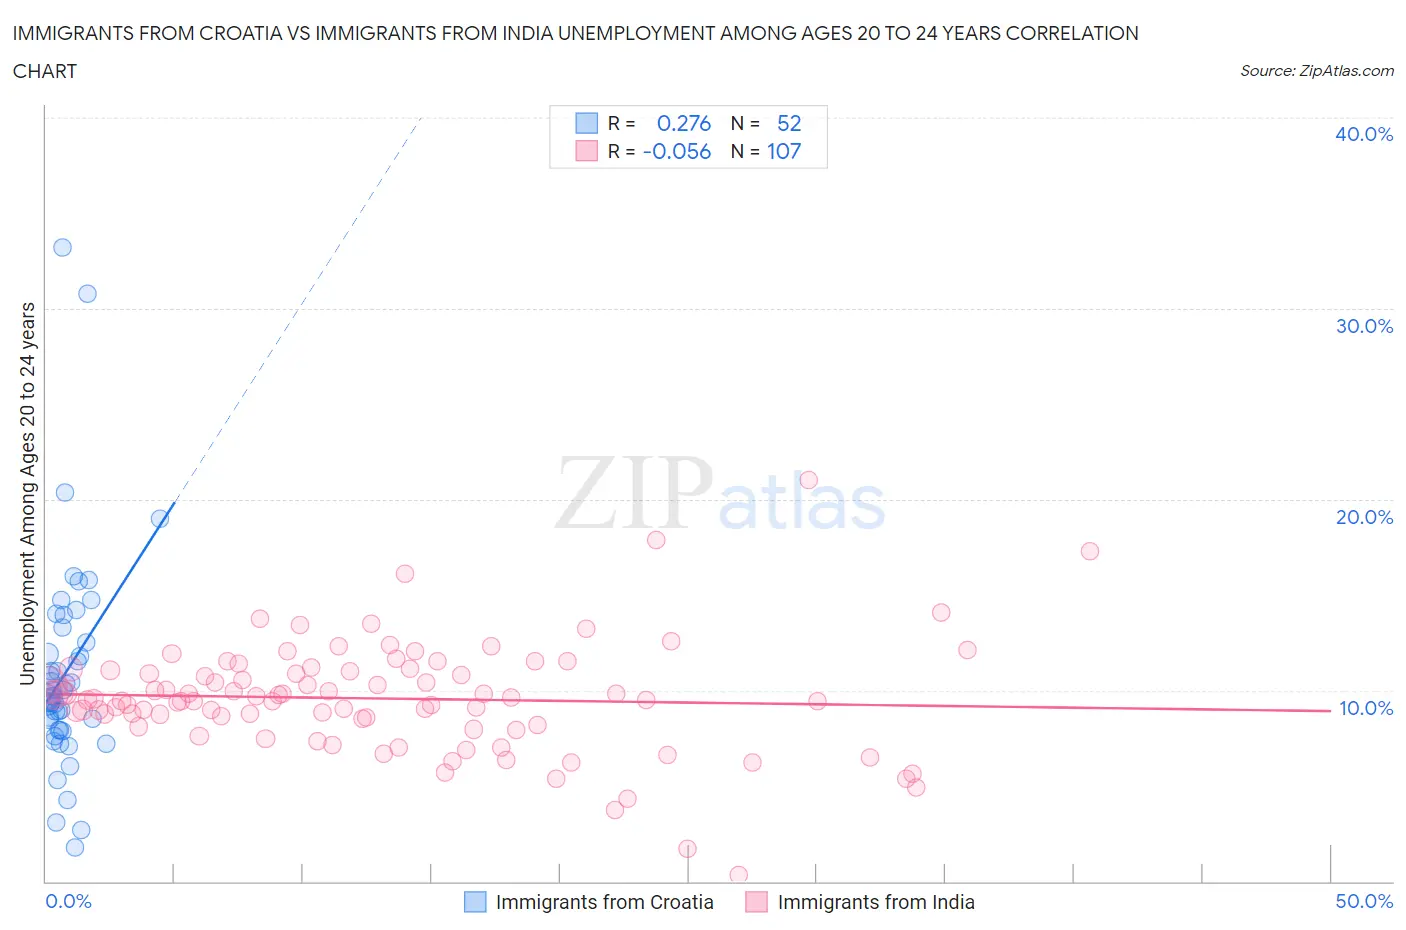
Immigrants from Croatia vs Immigrants from India Unemployment Among Ages 20 to 24 years Correlation Chart
The statistical analysis conducted on geographies consisting of 130,896,610 people shows a weak positive correlation between the proportion of Immigrants from Croatia and unemployment rate among population between the ages 20 and 24 in the United States with a correlation coefficient (R) of 0.276 and weighted average of 9.9%. Similarly, the statistical analysis conducted on geographies consisting of 420,067,171 people shows a slight negative correlation between the proportion of Immigrants from India and unemployment rate among population between the ages 20 and 24 in the United States with a correlation coefficient (R) of -0.056 and weighted average of 9.7%, a difference of 1.6%.
Unemployment Among Ages 20 to 24 years Correlation Summary
| Measurement | Immigrants from Croatia | Immigrants from India |
| Minimum | 1.8% | 0.30% |
| Maximum | 33.2% | 21.0% |
| Range | 31.4% | 20.7% |
| Mean | 11.0% | 9.6% |
| Median | 9.7% | 9.5% |
| Interquartile 25% (IQ1) | 7.9% | 8.2% |
| Interquartile 75% (IQ3) | 12.9% | 11.0% |
| Interquartile Range (IQR) | 5.0% | 2.8% |
| Standard Deviation (Sample) | 5.7% | 2.9% |
| Standard Deviation (Population) | 5.6% | 2.9% |
Similar Demographics by Unemployment Among Ages 20 to 24 years
Demographics Similar to Immigrants from Croatia by Unemployment Among Ages 20 to 24 years
In terms of unemployment among ages 20 to 24 years, the demographic groups most similar to Immigrants from Croatia are Celtic (9.9%, a difference of 0.030%), Bolivian (9.9%, a difference of 0.070%), Bulgarian (9.9%, a difference of 0.12%), Mongolian (9.9%, a difference of 0.20%), and Kenyan (9.9%, a difference of 0.21%).
| Demographics | Rating | Rank | Unemployment Among Ages 20 to 24 years |
| British | 99.4 /100 | #63 | Exceptional 9.8% |
| Serbians | 99.4 /100 | #64 | Exceptional 9.8% |
| Welsh | 99.3 /100 | #65 | Exceptional 9.8% |
| Scottish | 99.3 /100 | #66 | Exceptional 9.8% |
| Immigrants | Bolivia | 99.2 /100 | #67 | Exceptional 9.9% |
| Mongolians | 99.1 /100 | #68 | Exceptional 9.9% |
| Bulgarians | 99.1 /100 | #69 | Exceptional 9.9% |
| Immigrants | Croatia | 99.0 /100 | #70 | Exceptional 9.9% |
| Celtics | 98.9 /100 | #71 | Exceptional 9.9% |
| Bolivians | 98.9 /100 | #72 | Exceptional 9.9% |
| Kenyans | 98.7 /100 | #73 | Exceptional 9.9% |
| Immigrants | Laos | 98.7 /100 | #74 | Exceptional 9.9% |
| Immigrants | Australia | 98.6 /100 | #75 | Exceptional 9.9% |
| Czechoslovakians | 98.4 /100 | #76 | Exceptional 9.9% |
| Chickasaw | 98.4 /100 | #77 | Exceptional 9.9% |
Demographics Similar to Immigrants from India by Unemployment Among Ages 20 to 24 years
In terms of unemployment among ages 20 to 24 years, the demographic groups most similar to Immigrants from India are Finnish (9.7%, a difference of 0.010%), Creek (9.7%, a difference of 0.090%), Immigrants from Nicaragua (9.7%, a difference of 0.12%), Croatian (9.7%, a difference of 0.13%), and European (9.7%, a difference of 0.19%).
| Demographics | Rating | Rank | Unemployment Among Ages 20 to 24 years |
| Immigrants | Ethiopia | 99.9 /100 | #40 | Exceptional 9.6% |
| Swiss | 99.9 /100 | #41 | Exceptional 9.7% |
| Immigrants | Saudi Arabia | 99.9 /100 | #42 | Exceptional 9.7% |
| Menominee | 99.8 /100 | #43 | Exceptional 9.7% |
| Europeans | 99.8 /100 | #44 | Exceptional 9.7% |
| Croatians | 99.8 /100 | #45 | Exceptional 9.7% |
| Immigrants | Nicaragua | 99.8 /100 | #46 | Exceptional 9.7% |
| Immigrants | India | 99.8 /100 | #47 | Exceptional 9.7% |
| Finns | 99.8 /100 | #48 | Exceptional 9.7% |
| Creek | 99.8 /100 | #49 | Exceptional 9.7% |
| Immigrants | Kenya | 99.7 /100 | #50 | Exceptional 9.7% |
| Ethiopians | 99.7 /100 | #51 | Exceptional 9.8% |
| Immigrants | Thailand | 99.7 /100 | #52 | Exceptional 9.8% |
| Immigrants | Serbia | 99.6 /100 | #53 | Exceptional 9.8% |
| Immigrants | Cambodia | 99.6 /100 | #54 | Exceptional 9.8% |