Laotian vs Sierra Leonean Unemployment Among Ages 20 to 24 years
COMPARE
Laotian
Sierra Leonean
Unemployment Among Ages 20 to 24 years
Unemployment Among Ages 20 to 24 years Comparison
Laotians
Sierra Leoneans
10.0%
UNEMPLOYMENT AMONG AGES 20 TO 24 YEARS
95.1/ 100
METRIC RATING
101st/ 347
METRIC RANK
11.5%
UNEMPLOYMENT AMONG AGES 20 TO 24 YEARS
0.0/ 100
METRIC RATING
276th/ 347
METRIC RANK
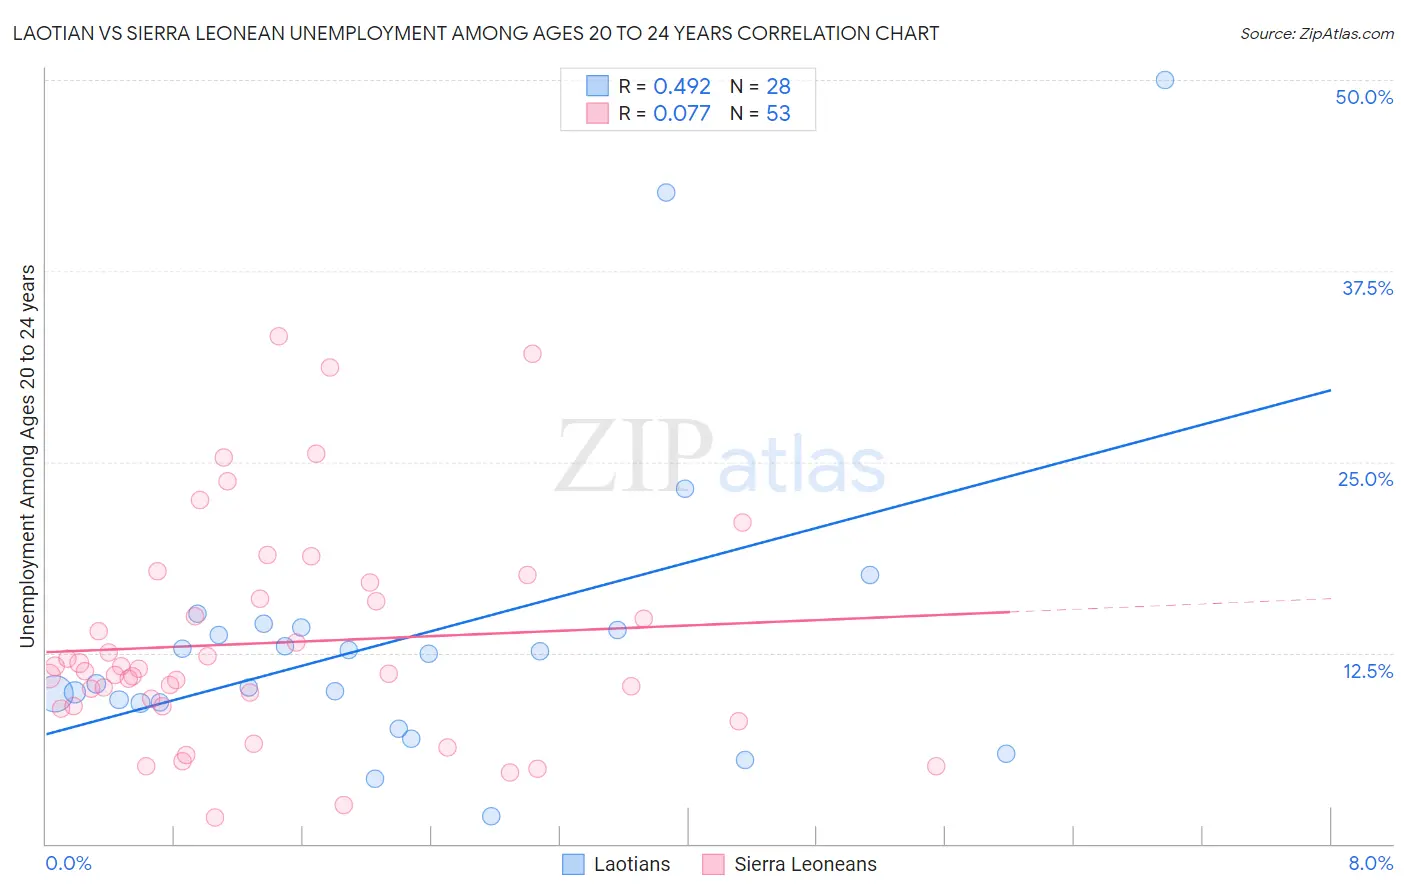
Laotian vs Sierra Leonean Unemployment Among Ages 20 to 24 years Correlation Chart
The statistical analysis conducted on geographies consisting of 222,318,463 people shows a moderate positive correlation between the proportion of Laotians and unemployment rate among population between the ages 20 and 24 in the United States with a correlation coefficient (R) of 0.492 and weighted average of 10.0%. Similarly, the statistical analysis conducted on geographies consisting of 82,974,679 people shows a slight positive correlation between the proportion of Sierra Leoneans and unemployment rate among population between the ages 20 and 24 in the United States with a correlation coefficient (R) of 0.077 and weighted average of 11.5%, a difference of 15.0%.
Unemployment Among Ages 20 to 24 years Correlation Summary
| Measurement | Laotian | Sierra Leonean |
| Minimum | 1.8% | 1.7% |
| Maximum | 50.0% | 33.2% |
| Range | 48.2% | 31.5% |
| Mean | 13.5% | 13.2% |
| Median | 11.5% | 11.3% |
| Interquartile 25% (IQ1) | 9.2% | 9.0% |
| Interquartile 75% (IQ3) | 14.1% | 16.6% |
| Interquartile Range (IQR) | 4.8% | 7.5% |
| Standard Deviation (Sample) | 10.2% | 7.2% |
| Standard Deviation (Population) | 10.1% | 7.1% |
Similar Demographics by Unemployment Among Ages 20 to 24 years
Demographics Similar to Laotians by Unemployment Among Ages 20 to 24 years
In terms of unemployment among ages 20 to 24 years, the demographic groups most similar to Laotians are Immigrants from France (10.0%, a difference of 0.030%), Fijian (10.0%, a difference of 0.040%), Immigrants from Argentina (10.0%, a difference of 0.050%), Japanese (10.0%, a difference of 0.060%), and Irish (10.0%, a difference of 0.16%).
| Demographics | Rating | Rank | Unemployment Among Ages 20 to 24 years |
| Immigrants | Micronesia | 96.6 /100 | #94 | Exceptional 10.0% |
| Scotch-Irish | 96.2 /100 | #95 | Exceptional 10.0% |
| Thais | 96.2 /100 | #96 | Exceptional 10.0% |
| Slavs | 96.1 /100 | #97 | Exceptional 10.0% |
| Japanese | 95.4 /100 | #98 | Exceptional 10.0% |
| Fijians | 95.3 /100 | #99 | Exceptional 10.0% |
| Immigrants | France | 95.2 /100 | #100 | Exceptional 10.0% |
| Laotians | 95.1 /100 | #101 | Exceptional 10.0% |
| Immigrants | Argentina | 94.9 /100 | #102 | Exceptional 10.0% |
| Irish | 94.3 /100 | #103 | Exceptional 10.0% |
| Immigrants | Chile | 94.0 /100 | #104 | Exceptional 10.0% |
| Immigrants | Hungary | 94.0 /100 | #105 | Exceptional 10.0% |
| Pennsylvania Germans | 93.9 /100 | #106 | Exceptional 10.0% |
| Iroquois | 93.4 /100 | #107 | Exceptional 10.1% |
| Immigrants | Latvia | 93.2 /100 | #108 | Exceptional 10.1% |
Demographics Similar to Sierra Leoneans by Unemployment Among Ages 20 to 24 years
In terms of unemployment among ages 20 to 24 years, the demographic groups most similar to Sierra Leoneans are Senegalese (11.5%, a difference of 0.040%), African (11.5%, a difference of 0.15%), Colville (11.6%, a difference of 0.17%), Cape Verdean (11.5%, a difference of 0.40%), and Bahamian (11.6%, a difference of 0.43%).
| Demographics | Rating | Rank | Unemployment Among Ages 20 to 24 years |
| Ute | 0.0 /100 | #269 | Tragic 11.2% |
| Delaware | 0.0 /100 | #270 | Tragic 11.3% |
| Immigrants | Uzbekistan | 0.0 /100 | #271 | Tragic 11.4% |
| Nigerians | 0.0 /100 | #272 | Tragic 11.4% |
| Immigrants | Nigeria | 0.0 /100 | #273 | Tragic 11.5% |
| Cape Verdeans | 0.0 /100 | #274 | Tragic 11.5% |
| Senegalese | 0.0 /100 | #275 | Tragic 11.5% |
| Sierra Leoneans | 0.0 /100 | #276 | Tragic 11.5% |
| Africans | 0.0 /100 | #277 | Tragic 11.5% |
| Colville | 0.0 /100 | #278 | Tragic 11.6% |
| Bahamians | 0.0 /100 | #279 | Tragic 11.6% |
| Alaskan Athabascans | 0.0 /100 | #280 | Tragic 11.6% |
| Armenians | 0.0 /100 | #281 | Tragic 11.7% |
| Immigrants | Cameroon | 0.0 /100 | #282 | Tragic 11.7% |
| Ghanaians | 0.0 /100 | #283 | Tragic 11.7% |