Immigrants from Croatia vs Salvadoran Unemployment Among Ages 25 to 29 years
COMPARE
Immigrants from Croatia
Salvadoran
Unemployment Among Ages 25 to 29 years
Unemployment Among Ages 25 to 29 years Comparison
Immigrants from Croatia
Salvadorans
6.5%
UNEMPLOYMENT AMONG AGES 25 TO 29 YEARS
75.5/ 100
METRIC RATING
135th/ 347
METRIC RANK
7.0%
UNEMPLOYMENT AMONG AGES 25 TO 29 YEARS
4.4/ 100
METRIC RATING
227th/ 347
METRIC RANK
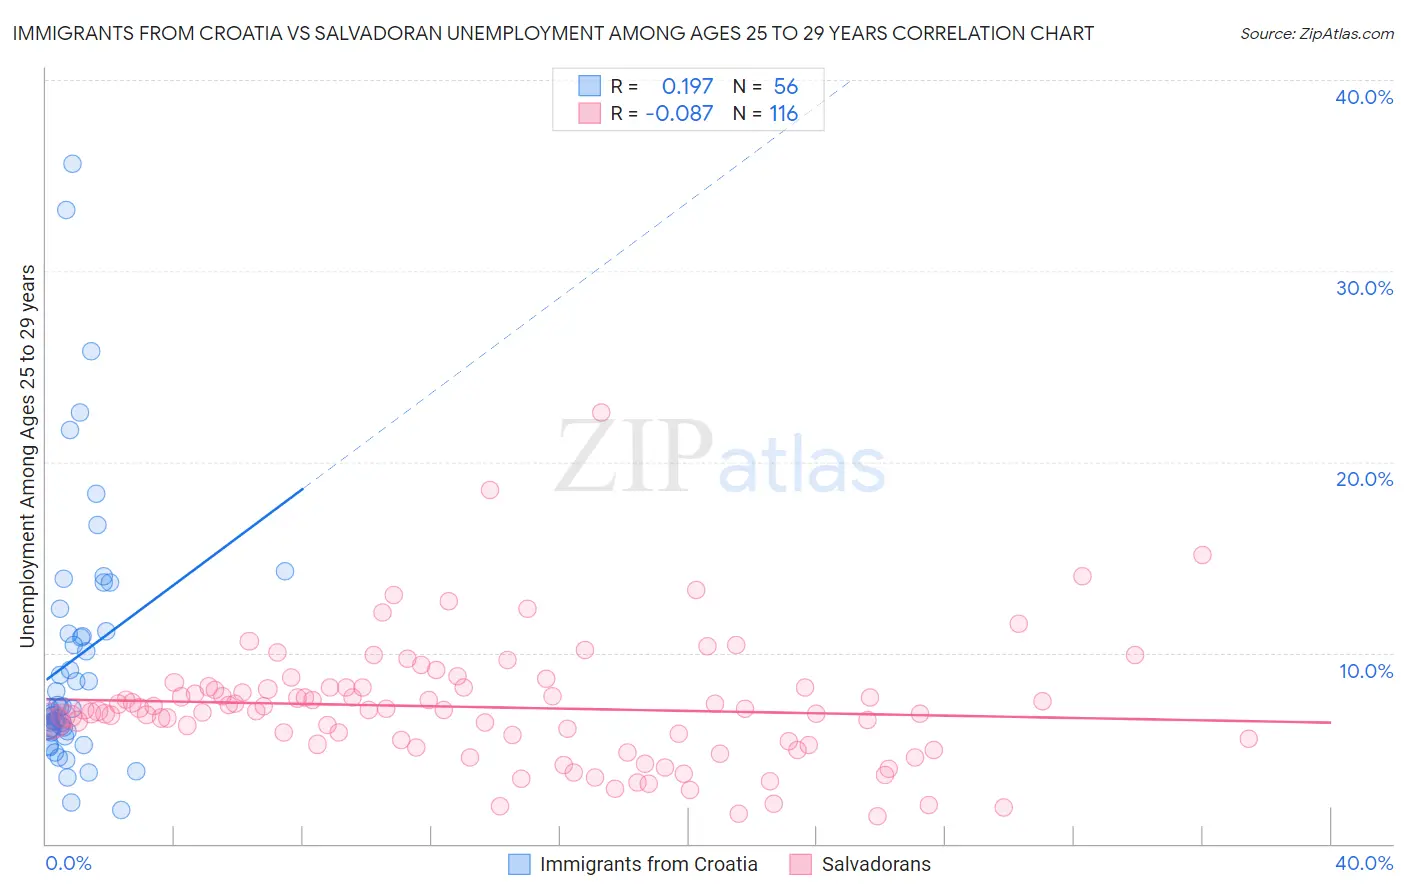
Immigrants from Croatia vs Salvadoran Unemployment Among Ages 25 to 29 years Correlation Chart
The statistical analysis conducted on geographies consisting of 129,972,680 people shows a poor positive correlation between the proportion of Immigrants from Croatia and unemployment rate among population between the ages 25 and 29 in the United States with a correlation coefficient (R) of 0.197 and weighted average of 6.5%. Similarly, the statistical analysis conducted on geographies consisting of 382,555,814 people shows a slight negative correlation between the proportion of Salvadorans and unemployment rate among population between the ages 25 and 29 in the United States with a correlation coefficient (R) of -0.087 and weighted average of 7.0%, a difference of 6.6%.
Unemployment Among Ages 25 to 29 years Correlation Summary
| Measurement | Immigrants from Croatia | Salvadoran |
| Minimum | 1.8% | 1.4% |
| Maximum | 35.6% | 22.6% |
| Range | 33.8% | 21.1% |
| Mean | 9.7% | 7.1% |
| Median | 7.1% | 7.0% |
| Interquartile 25% (IQ1) | 6.0% | 5.3% |
| Interquartile 75% (IQ3) | 11.1% | 8.2% |
| Interquartile Range (IQR) | 5.1% | 2.9% |
| Standard Deviation (Sample) | 6.9% | 3.2% |
| Standard Deviation (Population) | 6.8% | 3.2% |
Similar Demographics by Unemployment Among Ages 25 to 29 years
Demographics Similar to Immigrants from Croatia by Unemployment Among Ages 25 to 29 years
In terms of unemployment among ages 25 to 29 years, the demographic groups most similar to Immigrants from Croatia are Immigrants from Europe (6.5%, a difference of 0.010%), Immigrants from Vietnam (6.5%, a difference of 0.010%), Northern European (6.5%, a difference of 0.010%), Polish (6.5%, a difference of 0.090%), and Eastern European (6.5%, a difference of 0.12%).
| Demographics | Rating | Rank | Unemployment Among Ages 25 to 29 years |
| Immigrants | Chile | 80.5 /100 | #128 | Excellent 6.5% |
| Sri Lankans | 80.3 /100 | #129 | Excellent 6.5% |
| Immigrants | Peru | 79.9 /100 | #130 | Good 6.5% |
| Immigrants | Afghanistan | 79.2 /100 | #131 | Good 6.5% |
| Poles | 76.6 /100 | #132 | Good 6.5% |
| Immigrants | Europe | 75.7 /100 | #133 | Good 6.5% |
| Immigrants | Vietnam | 75.6 /100 | #134 | Good 6.5% |
| Immigrants | Croatia | 75.5 /100 | #135 | Good 6.5% |
| Northern Europeans | 75.4 /100 | #136 | Good 6.5% |
| Eastern Europeans | 74.1 /100 | #137 | Good 6.5% |
| Immigrants | Belgium | 73.8 /100 | #138 | Good 6.5% |
| Austrians | 73.8 /100 | #139 | Good 6.5% |
| Immigrants | Pakistan | 73.8 /100 | #140 | Good 6.5% |
| Maltese | 72.9 /100 | #141 | Good 6.5% |
| Slavs | 72.5 /100 | #142 | Good 6.5% |
Demographics Similar to Salvadorans by Unemployment Among Ages 25 to 29 years
In terms of unemployment among ages 25 to 29 years, the demographic groups most similar to Salvadorans are Immigrants from Panama (7.0%, a difference of 0.050%), Immigrants from Liberia (7.0%, a difference of 0.13%), Bermudan (7.0%, a difference of 0.21%), Immigrants from El Salvador (7.0%, a difference of 0.29%), and Japanese (6.9%, a difference of 0.32%).
| Demographics | Rating | Rank | Unemployment Among Ages 25 to 29 years |
| French | 10.5 /100 | #220 | Poor 6.9% |
| Israelis | 9.8 /100 | #221 | Tragic 6.9% |
| Spaniards | 7.7 /100 | #222 | Tragic 6.9% |
| Celtics | 7.6 /100 | #223 | Tragic 6.9% |
| Immigrants | Immigrants | 6.2 /100 | #224 | Tragic 6.9% |
| Japanese | 5.4 /100 | #225 | Tragic 6.9% |
| Immigrants | Liberia | 4.8 /100 | #226 | Tragic 7.0% |
| Salvadorans | 4.4 /100 | #227 | Tragic 7.0% |
| Immigrants | Panama | 4.2 /100 | #228 | Tragic 7.0% |
| Bermudans | 3.8 /100 | #229 | Tragic 7.0% |
| Immigrants | El Salvador | 3.6 /100 | #230 | Tragic 7.0% |
| Central Americans | 3.0 /100 | #231 | Tragic 7.0% |
| Spanish Americans | 2.7 /100 | #232 | Tragic 7.0% |
| Immigrants | Honduras | 2.4 /100 | #233 | Tragic 7.0% |
| French Canadians | 2.4 /100 | #234 | Tragic 7.0% |