Immigrants from Croatia vs Apache Unemployment Among Ages 25 to 29 years
COMPARE
Immigrants from Croatia
Apache
Unemployment Among Ages 25 to 29 years
Unemployment Among Ages 25 to 29 years Comparison
Immigrants from Croatia
Apache
6.5%
UNEMPLOYMENT AMONG AGES 25 TO 29 YEARS
75.5/ 100
METRIC RATING
135th/ 347
METRIC RANK
9.5%
UNEMPLOYMENT AMONG AGES 25 TO 29 YEARS
0.0/ 100
METRIC RATING
328th/ 347
METRIC RANK
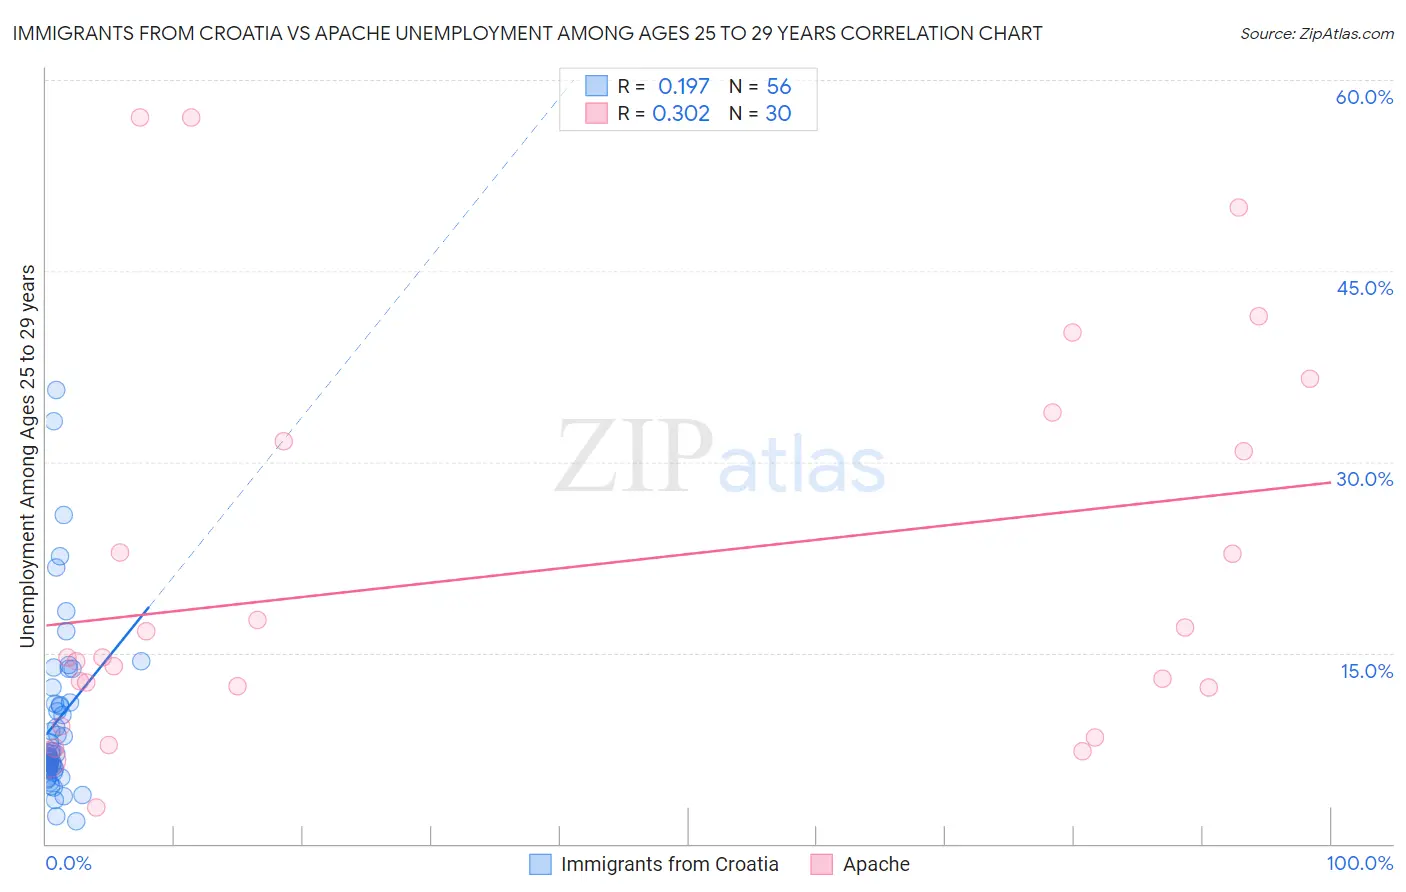
Immigrants from Croatia vs Apache Unemployment Among Ages 25 to 29 years Correlation Chart
The statistical analysis conducted on geographies consisting of 129,972,680 people shows a poor positive correlation between the proportion of Immigrants from Croatia and unemployment rate among population between the ages 25 and 29 in the United States with a correlation coefficient (R) of 0.197 and weighted average of 6.5%. Similarly, the statistical analysis conducted on geographies consisting of 224,498,621 people shows a mild positive correlation between the proportion of Apache and unemployment rate among population between the ages 25 and 29 in the United States with a correlation coefficient (R) of 0.302 and weighted average of 9.5%, a difference of 45.2%.
Unemployment Among Ages 25 to 29 years Correlation Summary
| Measurement | Immigrants from Croatia | Apache |
| Minimum | 1.8% | 2.8% |
| Maximum | 35.6% | 57.1% |
| Range | 33.8% | 54.3% |
| Mean | 9.7% | 21.5% |
| Median | 7.1% | 14.6% |
| Interquartile 25% (IQ1) | 6.0% | 12.3% |
| Interquartile 75% (IQ3) | 11.1% | 31.6% |
| Interquartile Range (IQR) | 5.1% | 19.3% |
| Standard Deviation (Sample) | 6.9% | 15.3% |
| Standard Deviation (Population) | 6.8% | 15.1% |
Similar Demographics by Unemployment Among Ages 25 to 29 years
Demographics Similar to Immigrants from Croatia by Unemployment Among Ages 25 to 29 years
In terms of unemployment among ages 25 to 29 years, the demographic groups most similar to Immigrants from Croatia are Immigrants from Europe (6.5%, a difference of 0.010%), Immigrants from Vietnam (6.5%, a difference of 0.010%), Northern European (6.5%, a difference of 0.010%), Polish (6.5%, a difference of 0.090%), and Eastern European (6.5%, a difference of 0.12%).
| Demographics | Rating | Rank | Unemployment Among Ages 25 to 29 years |
| Immigrants | Chile | 80.5 /100 | #128 | Excellent 6.5% |
| Sri Lankans | 80.3 /100 | #129 | Excellent 6.5% |
| Immigrants | Peru | 79.9 /100 | #130 | Good 6.5% |
| Immigrants | Afghanistan | 79.2 /100 | #131 | Good 6.5% |
| Poles | 76.6 /100 | #132 | Good 6.5% |
| Immigrants | Europe | 75.7 /100 | #133 | Good 6.5% |
| Immigrants | Vietnam | 75.6 /100 | #134 | Good 6.5% |
| Immigrants | Croatia | 75.5 /100 | #135 | Good 6.5% |
| Northern Europeans | 75.4 /100 | #136 | Good 6.5% |
| Eastern Europeans | 74.1 /100 | #137 | Good 6.5% |
| Immigrants | Belgium | 73.8 /100 | #138 | Good 6.5% |
| Austrians | 73.8 /100 | #139 | Good 6.5% |
| Immigrants | Pakistan | 73.8 /100 | #140 | Good 6.5% |
| Maltese | 72.9 /100 | #141 | Good 6.5% |
| Slavs | 72.5 /100 | #142 | Good 6.5% |
Demographics Similar to Apache by Unemployment Among Ages 25 to 29 years
In terms of unemployment among ages 25 to 29 years, the demographic groups most similar to Apache are Aleut (9.7%, a difference of 2.2%), Colville (9.2%, a difference of 2.6%), Shoshone (9.2%, a difference of 2.8%), Native/Alaskan (9.8%, a difference of 3.6%), and Alaska Native (10.2%, a difference of 7.5%).
| Demographics | Rating | Rank | Unemployment Among Ages 25 to 29 years |
| Immigrants | Dominican Republic | 0.0 /100 | #321 | Tragic 8.6% |
| Tlingit-Haida | 0.0 /100 | #322 | Tragic 8.7% |
| Dominicans | 0.0 /100 | #323 | Tragic 8.7% |
| Houma | 0.0 /100 | #324 | Tragic 8.7% |
| Yakama | 0.0 /100 | #325 | Tragic 8.8% |
| Shoshone | 0.0 /100 | #326 | Tragic 9.2% |
| Colville | 0.0 /100 | #327 | Tragic 9.2% |
| Apache | 0.0 /100 | #328 | Tragic 9.5% |
| Aleuts | 0.0 /100 | #329 | Tragic 9.7% |
| Natives/Alaskans | 0.0 /100 | #330 | Tragic 9.8% |
| Alaska Natives | 0.0 /100 | #331 | Tragic 10.2% |
| Pueblo | 0.0 /100 | #332 | Tragic 10.4% |
| Alaskan Athabascans | 0.0 /100 | #333 | Tragic 10.8% |
| Yuman | 0.0 /100 | #334 | Tragic 11.0% |
| Puerto Ricans | 0.0 /100 | #335 | Tragic 11.1% |