Immigrants from Croatia vs Cheyenne Unemployment Among Ages 25 to 29 years
COMPARE
Immigrants from Croatia
Cheyenne
Unemployment Among Ages 25 to 29 years
Unemployment Among Ages 25 to 29 years Comparison
Immigrants from Croatia
Cheyenne
6.5%
UNEMPLOYMENT AMONG AGES 25 TO 29 YEARS
75.5/ 100
METRIC RATING
135th/ 347
METRIC RANK
11.8%
UNEMPLOYMENT AMONG AGES 25 TO 29 YEARS
0.0/ 100
METRIC RATING
340th/ 347
METRIC RANK
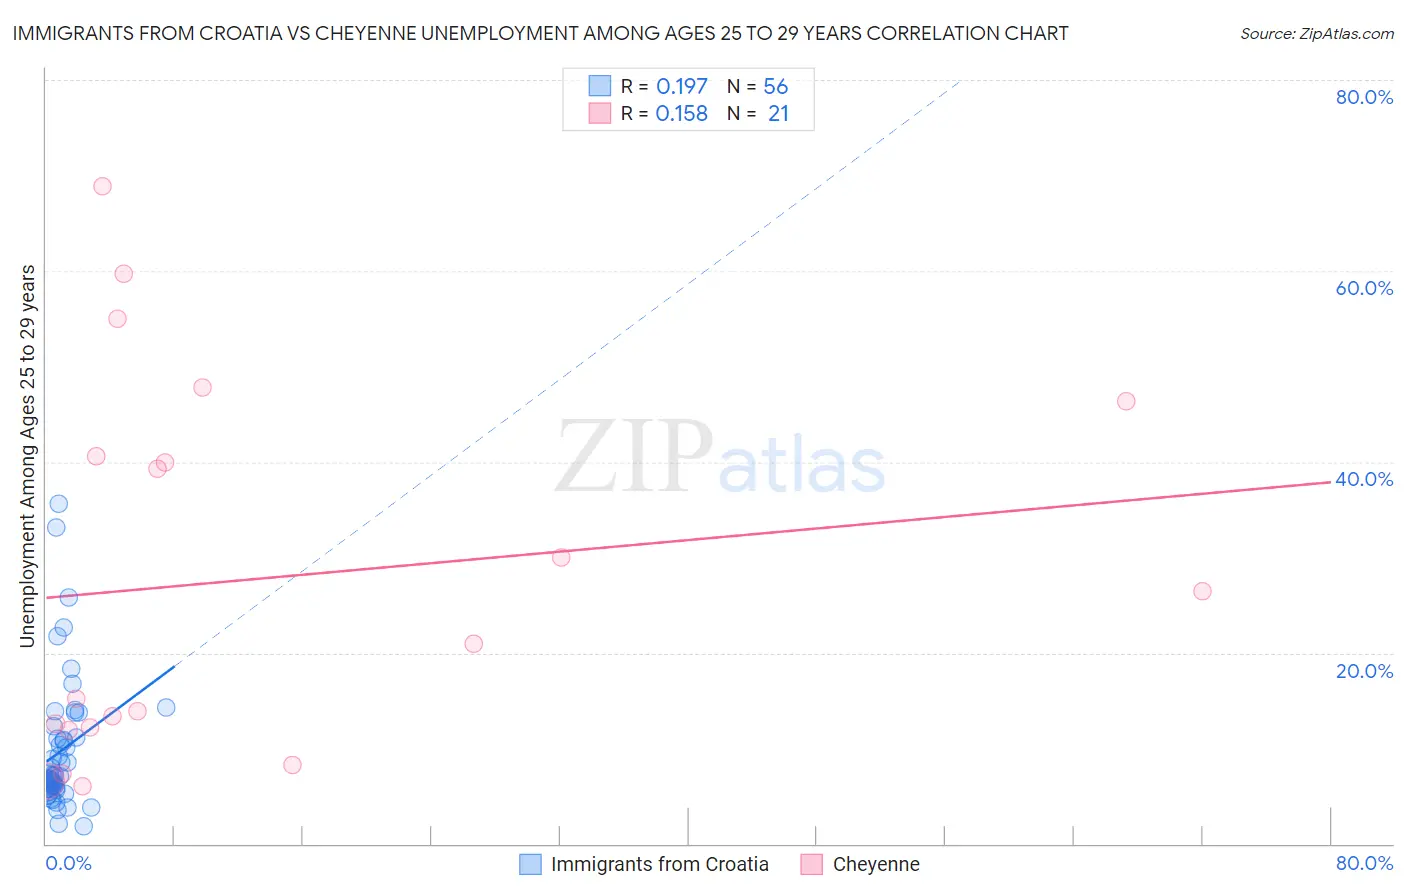
Immigrants from Croatia vs Cheyenne Unemployment Among Ages 25 to 29 years Correlation Chart
The statistical analysis conducted on geographies consisting of 129,972,680 people shows a poor positive correlation between the proportion of Immigrants from Croatia and unemployment rate among population between the ages 25 and 29 in the United States with a correlation coefficient (R) of 0.197 and weighted average of 6.5%. Similarly, the statistical analysis conducted on geographies consisting of 79,166,796 people shows a poor positive correlation between the proportion of Cheyenne and unemployment rate among population between the ages 25 and 29 in the United States with a correlation coefficient (R) of 0.158 and weighted average of 11.8%, a difference of 81.0%.
Unemployment Among Ages 25 to 29 years Correlation Summary
| Measurement | Immigrants from Croatia | Cheyenne |
| Minimum | 1.8% | 6.0% |
| Maximum | 35.6% | 68.9% |
| Range | 33.8% | 62.9% |
| Mean | 9.7% | 27.7% |
| Median | 7.1% | 20.9% |
| Interquartile 25% (IQ1) | 6.0% | 12.1% |
| Interquartile 75% (IQ3) | 11.1% | 43.5% |
| Interquartile Range (IQR) | 5.1% | 31.4% |
| Standard Deviation (Sample) | 6.9% | 19.6% |
| Standard Deviation (Population) | 6.8% | 19.2% |
Similar Demographics by Unemployment Among Ages 25 to 29 years
Demographics Similar to Immigrants from Croatia by Unemployment Among Ages 25 to 29 years
In terms of unemployment among ages 25 to 29 years, the demographic groups most similar to Immigrants from Croatia are Immigrants from Europe (6.5%, a difference of 0.010%), Immigrants from Vietnam (6.5%, a difference of 0.010%), Northern European (6.5%, a difference of 0.010%), Polish (6.5%, a difference of 0.090%), and Eastern European (6.5%, a difference of 0.12%).
| Demographics | Rating | Rank | Unemployment Among Ages 25 to 29 years |
| Immigrants | Chile | 80.5 /100 | #128 | Excellent 6.5% |
| Sri Lankans | 80.3 /100 | #129 | Excellent 6.5% |
| Immigrants | Peru | 79.9 /100 | #130 | Good 6.5% |
| Immigrants | Afghanistan | 79.2 /100 | #131 | Good 6.5% |
| Poles | 76.6 /100 | #132 | Good 6.5% |
| Immigrants | Europe | 75.7 /100 | #133 | Good 6.5% |
| Immigrants | Vietnam | 75.6 /100 | #134 | Good 6.5% |
| Immigrants | Croatia | 75.5 /100 | #135 | Good 6.5% |
| Northern Europeans | 75.4 /100 | #136 | Good 6.5% |
| Eastern Europeans | 74.1 /100 | #137 | Good 6.5% |
| Immigrants | Belgium | 73.8 /100 | #138 | Good 6.5% |
| Austrians | 73.8 /100 | #139 | Good 6.5% |
| Immigrants | Pakistan | 73.8 /100 | #140 | Good 6.5% |
| Maltese | 72.9 /100 | #141 | Good 6.5% |
| Slavs | 72.5 /100 | #142 | Good 6.5% |
Demographics Similar to Cheyenne by Unemployment Among Ages 25 to 29 years
In terms of unemployment among ages 25 to 29 years, the demographic groups most similar to Cheyenne are Pima (11.8%, a difference of 0.42%), Sioux (11.7%, a difference of 1.4%), Tohono O'odham (12.1%, a difference of 2.1%), Navajo (12.2%, a difference of 2.9%), and Menominee (11.3%, a difference of 4.9%).
| Demographics | Rating | Rank | Unemployment Among Ages 25 to 29 years |
| Alaskan Athabascans | 0.0 /100 | #333 | Tragic 10.8% |
| Yuman | 0.0 /100 | #334 | Tragic 11.0% |
| Puerto Ricans | 0.0 /100 | #335 | Tragic 11.1% |
| Lumbee | 0.0 /100 | #336 | Tragic 11.2% |
| Menominee | 0.0 /100 | #337 | Tragic 11.3% |
| Sioux | 0.0 /100 | #338 | Tragic 11.7% |
| Pima | 0.0 /100 | #339 | Tragic 11.8% |
| Cheyenne | 0.0 /100 | #340 | Tragic 11.8% |
| Tohono O'odham | 0.0 /100 | #341 | Tragic 12.1% |
| Navajo | 0.0 /100 | #342 | Tragic 12.2% |
| Inupiat | 0.0 /100 | #343 | Tragic 13.4% |
| Hopi | 0.0 /100 | #344 | Tragic 13.5% |
| Arapaho | 0.0 /100 | #345 | Tragic 15.4% |
| Crow | 0.0 /100 | #346 | Tragic 15.4% |
| Yup'ik | 0.0 /100 | #347 | Tragic 17.9% |