Immigrants from Congo vs Asian Unemployment Among Youth under 25 years
COMPARE
Immigrants from Congo
Asian
Unemployment Among Youth under 25 years
Unemployment Among Youth under 25 years Comparison
Immigrants from Congo
Asians
10.9%
UNEMPLOYMENT AMONG YOUTH UNDER 25 YEARS
99.8/ 100
METRIC RATING
38th/ 347
METRIC RANK
11.4%
UNEMPLOYMENT AMONG YOUTH UNDER 25 YEARS
79.7/ 100
METRIC RATING
137th/ 347
METRIC RANK
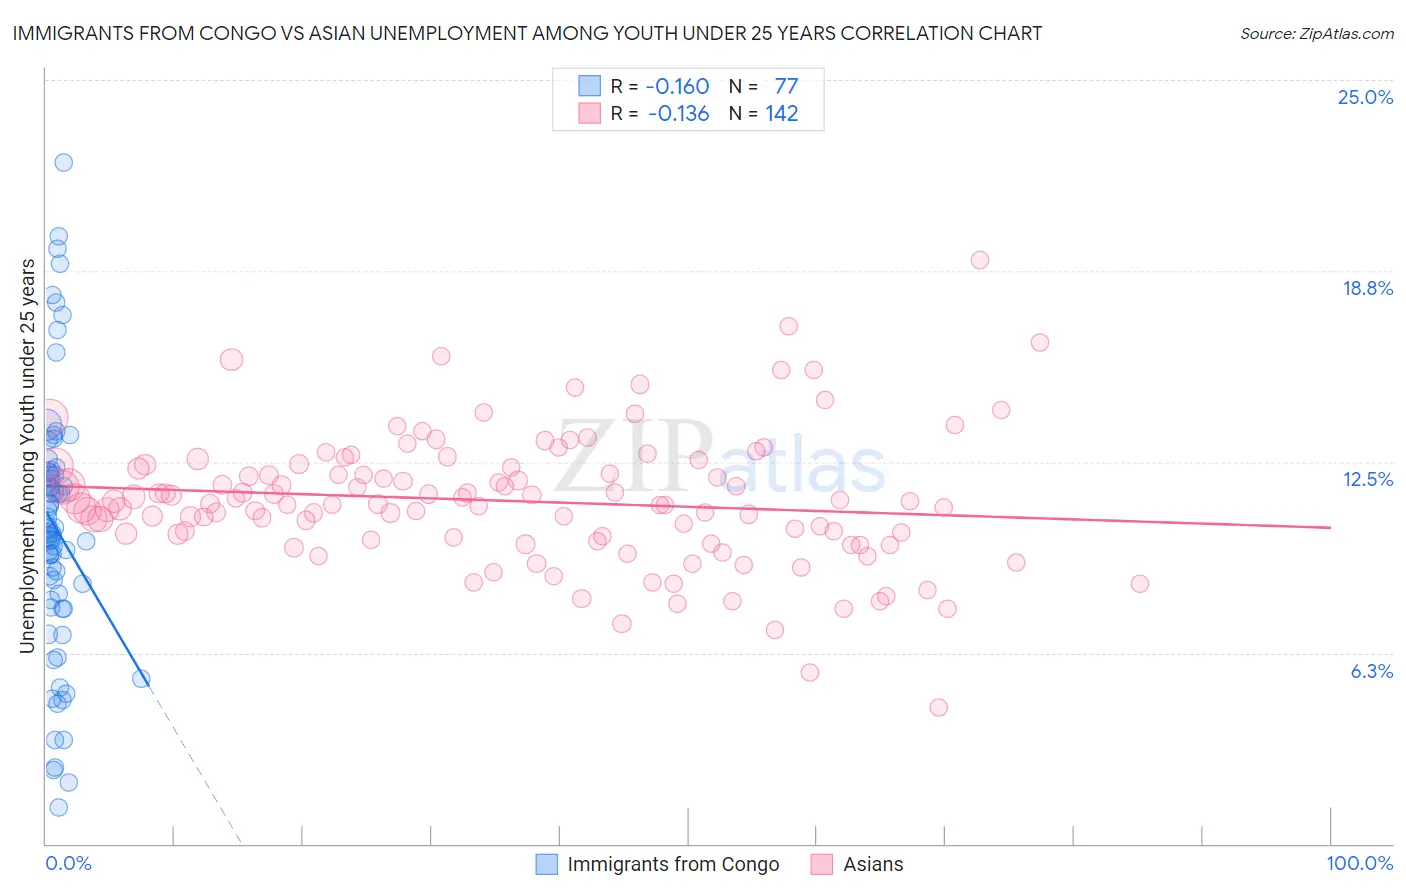
Immigrants from Congo vs Asian Unemployment Among Youth under 25 years Correlation Chart
The statistical analysis conducted on geographies consisting of 91,969,114 people shows a poor negative correlation between the proportion of Immigrants from Congo and unemployment rate among youth under the age of 25 in the United States with a correlation coefficient (R) of -0.160 and weighted average of 10.9%. Similarly, the statistical analysis conducted on geographies consisting of 533,644,399 people shows a poor negative correlation between the proportion of Asians and unemployment rate among youth under the age of 25 in the United States with a correlation coefficient (R) of -0.136 and weighted average of 11.4%, a difference of 5.4%.
Unemployment Among Youth under 25 years Correlation Summary
| Measurement | Immigrants from Congo | Asian |
| Minimum | 1.2% | 4.5% |
| Maximum | 22.3% | 19.1% |
| Range | 21.1% | 14.6% |
| Mean | 10.3% | 11.2% |
| Median | 10.2% | 11.1% |
| Interquartile 25% (IQ1) | 7.8% | 10.0% |
| Interquartile 75% (IQ3) | 12.2% | 12.3% |
| Interquartile Range (IQR) | 4.3% | 2.3% |
| Standard Deviation (Sample) | 4.3% | 2.1% |
| Standard Deviation (Population) | 4.2% | 2.1% |
Similar Demographics by Unemployment Among Youth under 25 years
Demographics Similar to Immigrants from Congo by Unemployment Among Youth under 25 years
In terms of unemployment among youth under 25 years, the demographic groups most similar to Immigrants from Congo are Immigrants from Zaire (10.9%, a difference of 0.010%), Immigrants from Zimbabwe (10.8%, a difference of 0.070%), Scottish (10.9%, a difference of 0.17%), Hmong (10.8%, a difference of 0.23%), and Croatian (10.9%, a difference of 0.27%).
| Demographics | Rating | Rank | Unemployment Among Youth under 25 years |
| Slovenes | 99.9 /100 | #31 | Exceptional 10.7% |
| Taiwanese | 99.9 /100 | #32 | Exceptional 10.8% |
| Europeans | 99.9 /100 | #33 | Exceptional 10.8% |
| English | 99.9 /100 | #34 | Exceptional 10.8% |
| Immigrants | Nepal | 99.9 /100 | #35 | Exceptional 10.8% |
| Hmong | 99.8 /100 | #36 | Exceptional 10.8% |
| Immigrants | Zimbabwe | 99.8 /100 | #37 | Exceptional 10.8% |
| Immigrants | Congo | 99.8 /100 | #38 | Exceptional 10.9% |
| Immigrants | Zaire | 99.8 /100 | #39 | Exceptional 10.9% |
| Scottish | 99.8 /100 | #40 | Exceptional 10.9% |
| Croatians | 99.8 /100 | #41 | Exceptional 10.9% |
| Cambodians | 99.7 /100 | #42 | Exceptional 10.9% |
| British | 99.7 /100 | #43 | Exceptional 10.9% |
| Welsh | 99.7 /100 | #44 | Exceptional 10.9% |
| Bulgarians | 99.6 /100 | #45 | Exceptional 10.9% |
Demographics Similar to Asians by Unemployment Among Youth under 25 years
In terms of unemployment among youth under 25 years, the demographic groups most similar to Asians are Romanian (11.4%, a difference of 0.030%), Immigrants from Oceania (11.4%, a difference of 0.040%), Immigrants from Chile (11.4%, a difference of 0.050%), Immigrants from England (11.5%, a difference of 0.10%), and Immigrants from Indonesia (11.5%, a difference of 0.13%).
| Demographics | Rating | Rank | Unemployment Among Youth under 25 years |
| Hungarians | 85.7 /100 | #130 | Excellent 11.4% |
| Immigrants | Spain | 84.6 /100 | #131 | Excellent 11.4% |
| Ethiopians | 83.2 /100 | #132 | Excellent 11.4% |
| Lebanese | 83.1 /100 | #133 | Excellent 11.4% |
| Immigrants | Chile | 80.4 /100 | #134 | Excellent 11.4% |
| Immigrants | Oceania | 80.2 /100 | #135 | Excellent 11.4% |
| Romanians | 80.1 /100 | #136 | Excellent 11.4% |
| Asians | 79.7 /100 | #137 | Good 11.4% |
| Immigrants | England | 78.1 /100 | #138 | Good 11.5% |
| Immigrants | Indonesia | 77.6 /100 | #139 | Good 11.5% |
| Immigrants | Belgium | 77.5 /100 | #140 | Good 11.5% |
| Immigrants | Uruguay | 76.1 /100 | #141 | Good 11.5% |
| Immigrants | Korea | 75.1 /100 | #142 | Good 11.5% |
| Immigrants | Uganda | 74.5 /100 | #143 | Good 11.5% |
| Immigrants | Brazil | 74.3 /100 | #144 | Good 11.5% |