Immigrants from Congo vs Immigrants from Somalia Family Households
COMPARE
Immigrants from Congo
Immigrants from Somalia
Family Households
Family Households Comparison
Immigrants from Congo
Immigrants from Somalia
59.2%
FAMILY HOUSEHOLDS
0.0/ 100
METRIC RATING
344th/ 347
METRIC RANK
56.7%
FAMILY HOUSEHOLDS
0.0/ 100
METRIC RATING
347th/ 347
METRIC RANK
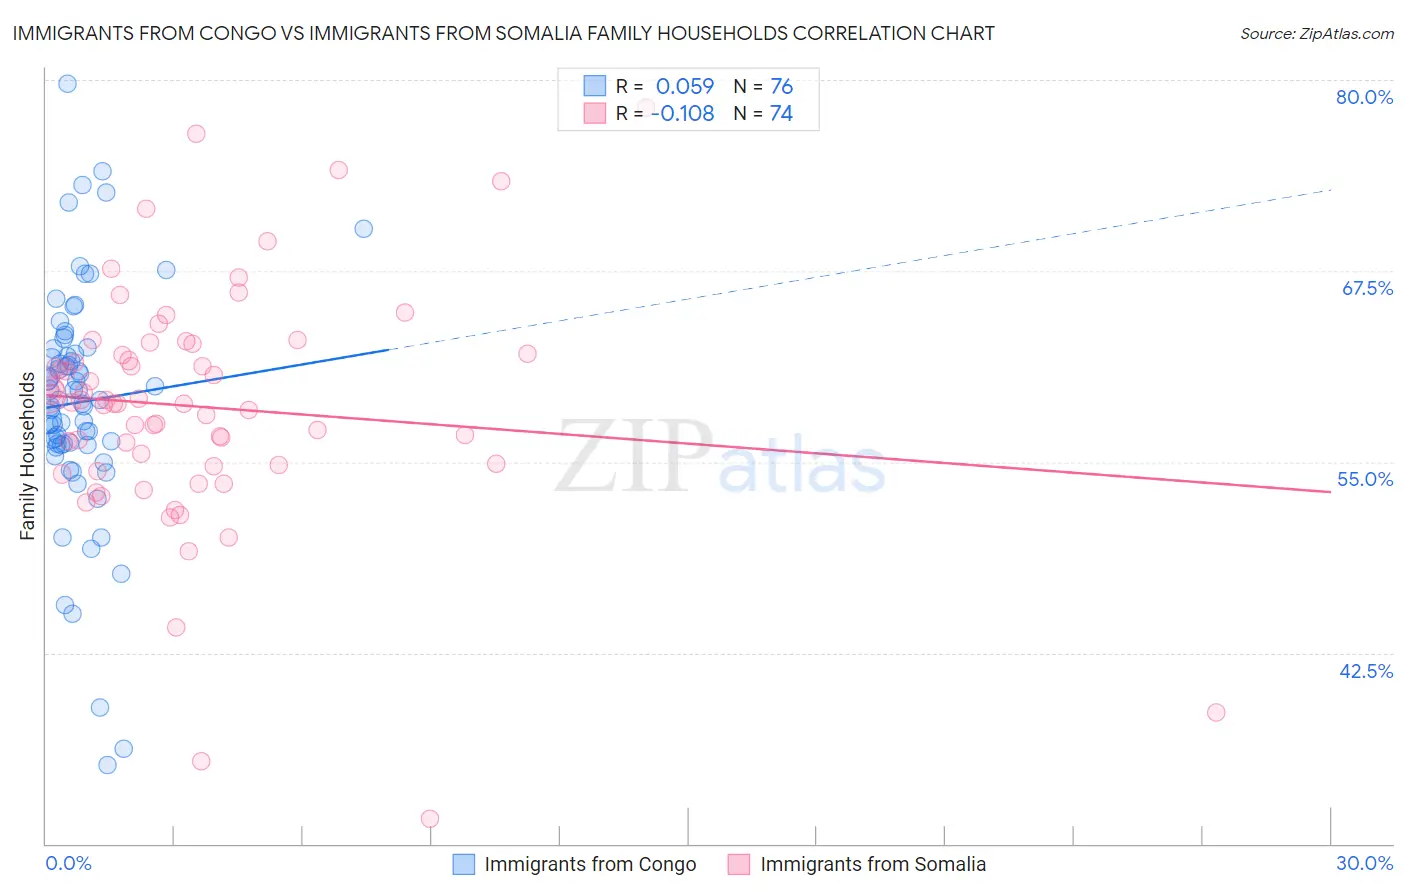
Immigrants from Congo vs Immigrants from Somalia Family Households Correlation Chart
The statistical analysis conducted on geographies consisting of 92,089,117 people shows a slight positive correlation between the proportion of Immigrants from Congo and percentage of family households in the United States with a correlation coefficient (R) of 0.059 and weighted average of 59.2%. Similarly, the statistical analysis conducted on geographies consisting of 92,092,225 people shows a poor negative correlation between the proportion of Immigrants from Somalia and percentage of family households in the United States with a correlation coefficient (R) of -0.108 and weighted average of 56.7%, a difference of 4.5%.
Family Households Correlation Summary
| Measurement | Immigrants from Congo | Immigrants from Somalia |
| Minimum | 35.2% | 31.6% |
| Maximum | 79.8% | 78.2% |
| Range | 44.6% | 46.6% |
| Mean | 58.9% | 58.6% |
| Median | 59.0% | 58.9% |
| Interquartile 25% (IQ1) | 56.1% | 54.8% |
| Interquartile 75% (IQ3) | 62.2% | 62.1% |
| Interquartile Range (IQR) | 6.1% | 7.3% |
| Standard Deviation (Sample) | 7.7% | 7.8% |
| Standard Deviation (Population) | 7.6% | 7.8% |
Demographics Similar to Immigrants from Congo and Immigrants from Somalia by Family Households
In terms of family households, the demographic groups most similar to Immigrants from Congo are Immigrants from Zaire (59.2%, a difference of 0.14%), Senegalese (59.8%, a difference of 0.97%), Sudanese (60.0%, a difference of 1.3%), Immigrants from Senegal (60.1%, a difference of 1.5%), and Immigrants from Sudan (60.2%, a difference of 1.5%). Similarly, the demographic groups most similar to Immigrants from Somalia are Somali (57.6%, a difference of 1.7%), Immigrants from Zaire (59.2%, a difference of 4.4%), Senegalese (59.8%, a difference of 5.6%), Sudanese (60.0%, a difference of 5.9%), and Immigrants from Senegal (60.1%, a difference of 6.1%).
| Demographics | Rating | Rank | Family Households |
| Kiowa | 0.0 /100 | #328 | Tragic 61.4% |
| Cambodians | 0.0 /100 | #329 | Tragic 61.4% |
| Immigrants | Australia | 0.0 /100 | #330 | Tragic 61.3% |
| Immigrants | France | 0.0 /100 | #331 | Tragic 61.3% |
| Ethiopians | 0.0 /100 | #332 | Tragic 61.2% |
| Immigrants | Ethiopia | 0.0 /100 | #333 | Tragic 61.2% |
| Immigrants | Eastern Africa | 0.0 /100 | #334 | Tragic 61.1% |
| Carpatho Rusyns | 0.0 /100 | #335 | Tragic 61.1% |
| German Russians | 0.0 /100 | #336 | Tragic 60.9% |
| Soviet Union | 0.0 /100 | #337 | Tragic 60.9% |
| Immigrants | Eritrea | 0.0 /100 | #338 | Tragic 60.8% |
| Immigrants | Saudi Arabia | 0.0 /100 | #339 | Tragic 60.7% |
| Immigrants | Sudan | 0.0 /100 | #340 | Tragic 60.2% |
| Immigrants | Senegal | 0.0 /100 | #341 | Tragic 60.1% |
| Sudanese | 0.0 /100 | #342 | Tragic 60.0% |
| Senegalese | 0.0 /100 | #343 | Tragic 59.8% |
| Immigrants | Congo | 0.0 /100 | #344 | Tragic 59.2% |
| Immigrants | Zaire | 0.0 /100 | #345 | Tragic 59.2% |
| Somalis | 0.0 /100 | #346 | Tragic 57.6% |
| Immigrants | Somalia | 0.0 /100 | #347 | Tragic 56.7% |