Immigrants from China vs Immigrants from Colombia Unemployment Among Ages 20 to 24 years
COMPARE
Immigrants from China
Immigrants from Colombia
Unemployment Among Ages 20 to 24 years
Unemployment Among Ages 20 to 24 years Comparison
Immigrants from China
Immigrants from Colombia
10.4%
UNEMPLOYMENT AMONG AGES 20 TO 24 YEARS
32.6/ 100
METRIC RATING
190th/ 347
METRIC RANK
10.3%
UNEMPLOYMENT AMONG AGES 20 TO 24 YEARS
56.3/ 100
METRIC RATING
169th/ 347
METRIC RANK
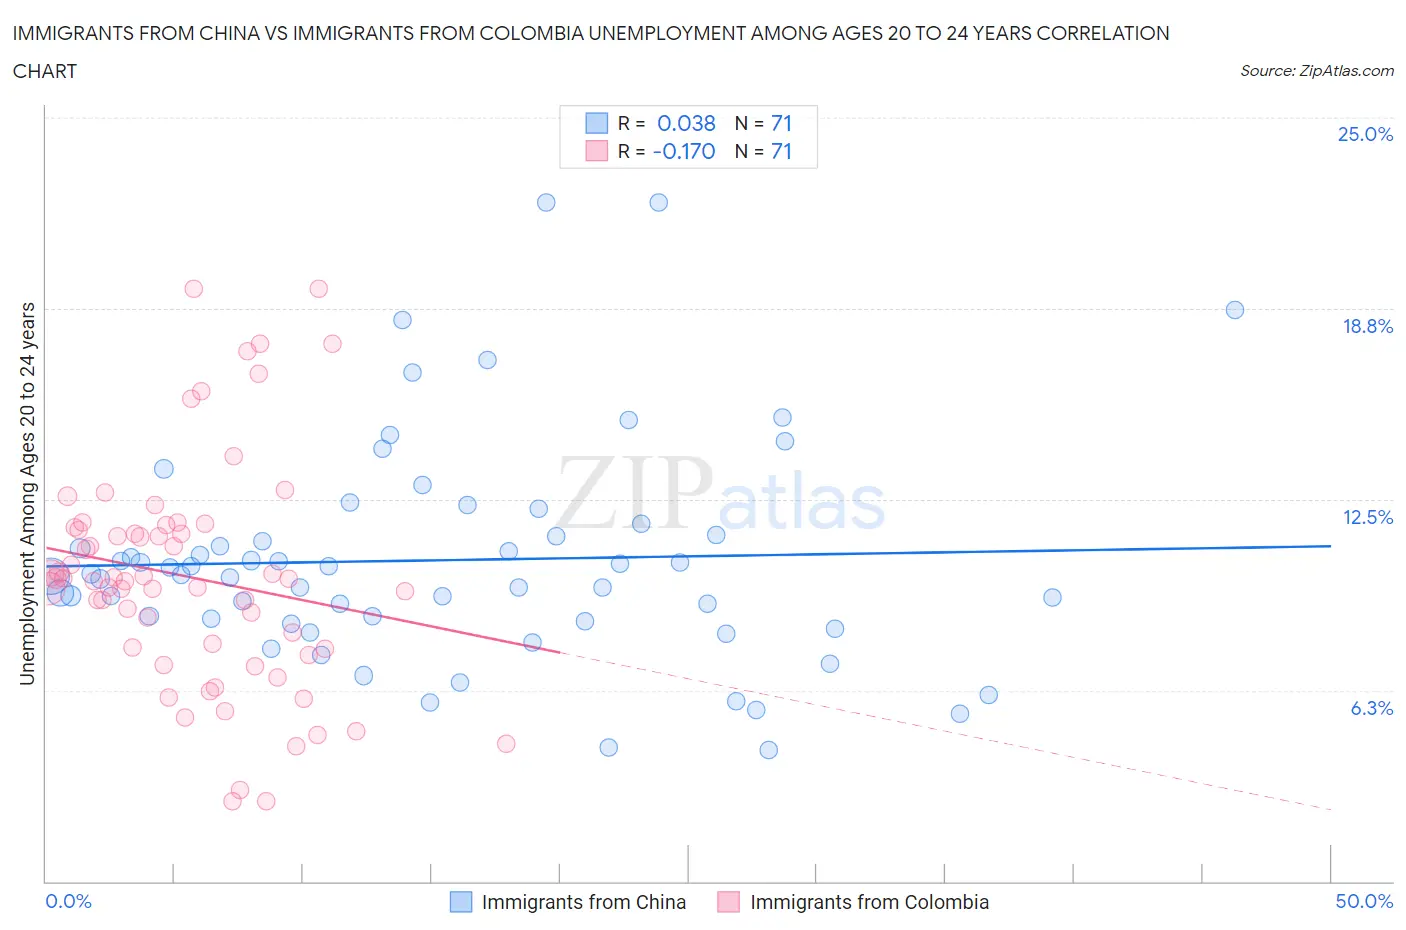
Immigrants from China vs Immigrants from Colombia Unemployment Among Ages 20 to 24 years Correlation Chart
The statistical analysis conducted on geographies consisting of 439,768,466 people shows no correlation between the proportion of Immigrants from China and unemployment rate among population between the ages 20 and 24 in the United States with a correlation coefficient (R) of 0.038 and weighted average of 10.4%. Similarly, the statistical analysis conducted on geographies consisting of 369,036,821 people shows a poor negative correlation between the proportion of Immigrants from Colombia and unemployment rate among population between the ages 20 and 24 in the United States with a correlation coefficient (R) of -0.170 and weighted average of 10.3%, a difference of 0.90%.
Unemployment Among Ages 20 to 24 years Correlation Summary
| Measurement | Immigrants from China | Immigrants from Colombia |
| Minimum | 4.3% | 2.6% |
| Maximum | 22.2% | 19.4% |
| Range | 17.9% | 16.8% |
| Mean | 10.5% | 9.9% |
| Median | 10.0% | 9.9% |
| Interquartile 25% (IQ1) | 8.5% | 7.6% |
| Interquartile 75% (IQ3) | 11.3% | 11.6% |
| Interquartile Range (IQR) | 2.8% | 4.0% |
| Standard Deviation (Sample) | 3.6% | 3.7% |
| Standard Deviation (Population) | 3.6% | 3.7% |
Similar Demographics by Unemployment Among Ages 20 to 24 years
Demographics Similar to Immigrants from China by Unemployment Among Ages 20 to 24 years
In terms of unemployment among ages 20 to 24 years, the demographic groups most similar to Immigrants from China are Hawaiian (10.4%, a difference of 0.050%), Immigrants from Russia (10.4%, a difference of 0.080%), Immigrants from Western Europe (10.4%, a difference of 0.10%), Guamanian/Chamorro (10.4%, a difference of 0.11%), and Syrian (10.4%, a difference of 0.12%).
| Demographics | Rating | Rank | Unemployment Among Ages 20 to 24 years |
| Immigrants | Egypt | 37.4 /100 | #183 | Fair 10.4% |
| Greeks | 37.2 /100 | #184 | Fair 10.4% |
| Syrians | 35.6 /100 | #185 | Fair 10.4% |
| Guamanians/Chamorros | 35.4 /100 | #186 | Fair 10.4% |
| Immigrants | Western Europe | 35.0 /100 | #187 | Fair 10.4% |
| Immigrants | Russia | 34.6 /100 | #188 | Fair 10.4% |
| Hawaiians | 33.9 /100 | #189 | Fair 10.4% |
| Immigrants | China | 32.6 /100 | #190 | Fair 10.4% |
| Immigrants | Eastern Europe | 25.8 /100 | #191 | Fair 10.4% |
| Ugandans | 25.7 /100 | #192 | Fair 10.4% |
| Immigrants | Portugal | 25.3 /100 | #193 | Fair 10.4% |
| Immigrants | Italy | 25.0 /100 | #194 | Fair 10.4% |
| Egyptians | 24.5 /100 | #195 | Fair 10.4% |
| Immigrants | Philippines | 24.1 /100 | #196 | Fair 10.4% |
| Immigrants | Denmark | 22.8 /100 | #197 | Fair 10.4% |
Demographics Similar to Immigrants from Colombia by Unemployment Among Ages 20 to 24 years
In terms of unemployment among ages 20 to 24 years, the demographic groups most similar to Immigrants from Colombia are Iraqi (10.3%, a difference of 0.020%), Turkish (10.3%, a difference of 0.040%), Italian (10.3%, a difference of 0.050%), Immigrants from Fiji (10.3%, a difference of 0.050%), and Lebanese (10.3%, a difference of 0.070%).
| Demographics | Rating | Rank | Unemployment Among Ages 20 to 24 years |
| Immigrants | Asia | 61.3 /100 | #162 | Good 10.3% |
| Estonians | 61.1 /100 | #163 | Good 10.3% |
| Immigrants | Korea | 59.0 /100 | #164 | Average 10.3% |
| Lebanese | 58.3 /100 | #165 | Average 10.3% |
| Italians | 57.7 /100 | #166 | Average 10.3% |
| Immigrants | Fiji | 57.6 /100 | #167 | Average 10.3% |
| Iraqis | 56.7 /100 | #168 | Average 10.3% |
| Immigrants | Colombia | 56.3 /100 | #169 | Average 10.3% |
| Turks | 55.2 /100 | #170 | Average 10.3% |
| Immigrants | Eastern Asia | 52.7 /100 | #171 | Average 10.3% |
| Koreans | 51.9 /100 | #172 | Average 10.3% |
| Immigrants | Sweden | 50.8 /100 | #173 | Average 10.3% |
| Ukrainians | 50.0 /100 | #174 | Average 10.3% |
| Samoans | 45.4 /100 | #175 | Average 10.3% |
| Potawatomi | 42.0 /100 | #176 | Average 10.3% |