Immigrants from China vs Hmong Unemployment Among Ages 20 to 24 years
COMPARE
Immigrants from China
Hmong
Unemployment Among Ages 20 to 24 years
Unemployment Among Ages 20 to 24 years Comparison
Immigrants from China
Hmong
10.4%
UNEMPLOYMENT AMONG AGES 20 TO 24 YEARS
32.6/ 100
METRIC RATING
190th/ 347
METRIC RANK
9.4%
UNEMPLOYMENT AMONG AGES 20 TO 24 YEARS
100.0/ 100
METRIC RATING
19th/ 347
METRIC RANK
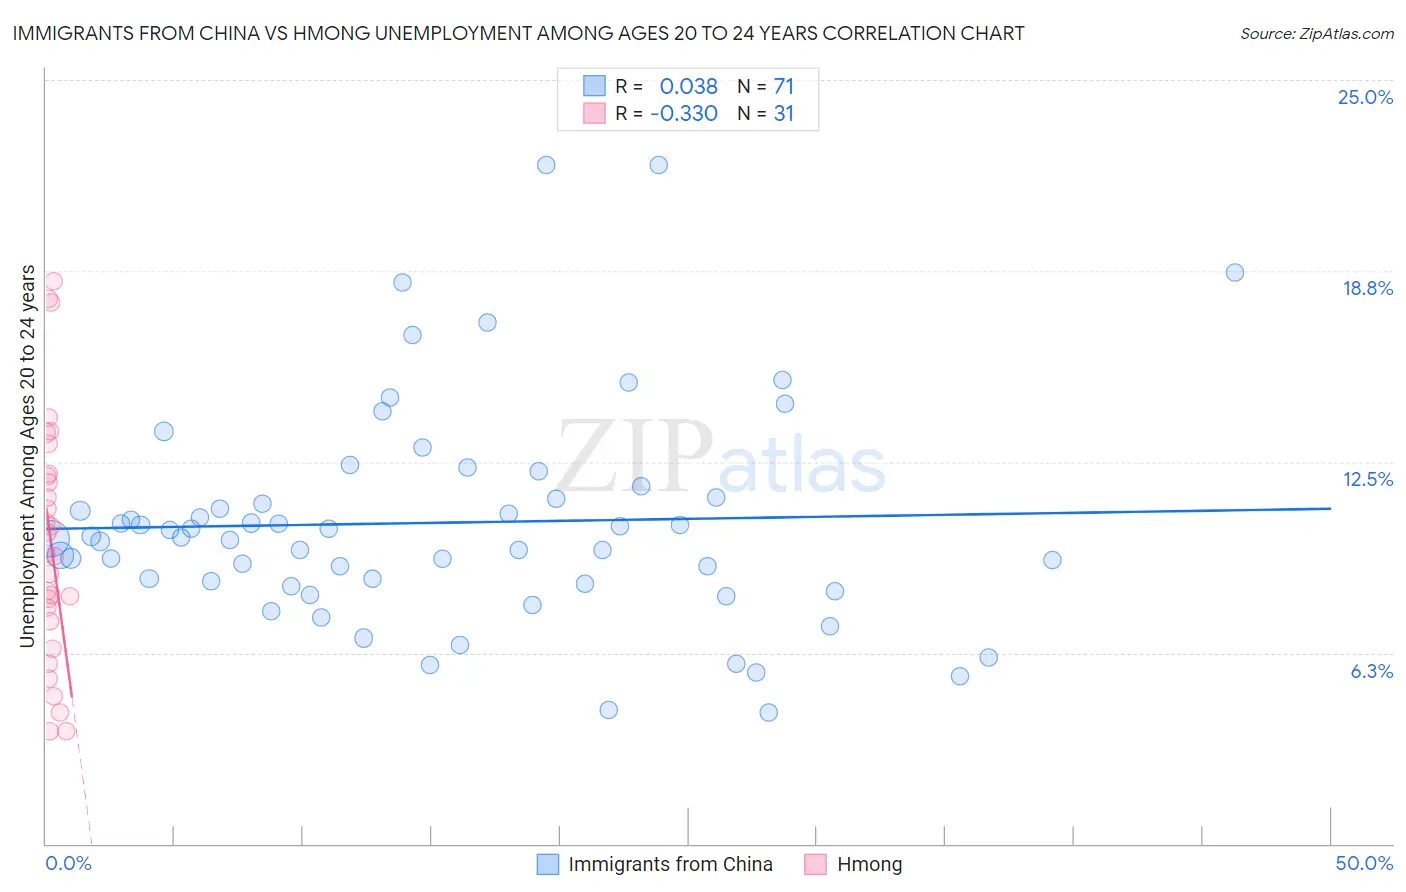
Immigrants from China vs Hmong Unemployment Among Ages 20 to 24 years Correlation Chart
The statistical analysis conducted on geographies consisting of 439,768,466 people shows no correlation between the proportion of Immigrants from China and unemployment rate among population between the ages 20 and 24 in the United States with a correlation coefficient (R) of 0.038 and weighted average of 10.4%. Similarly, the statistical analysis conducted on geographies consisting of 24,629,146 people shows a mild negative correlation between the proportion of Hmong and unemployment rate among population between the ages 20 and 24 in the United States with a correlation coefficient (R) of -0.330 and weighted average of 9.4%, a difference of 10.6%.
Unemployment Among Ages 20 to 24 years Correlation Summary
| Measurement | Immigrants from China | Hmong |
| Minimum | 4.3% | 3.7% |
| Maximum | 22.2% | 18.4% |
| Range | 17.9% | 14.7% |
| Mean | 10.5% | 9.9% |
| Median | 10.0% | 9.5% |
| Interquartile 25% (IQ1) | 8.5% | 7.3% |
| Interquartile 75% (IQ3) | 11.3% | 12.1% |
| Interquartile Range (IQR) | 2.8% | 4.8% |
| Standard Deviation (Sample) | 3.6% | 4.0% |
| Standard Deviation (Population) | 3.6% | 3.9% |
Similar Demographics by Unemployment Among Ages 20 to 24 years
Demographics Similar to Immigrants from China by Unemployment Among Ages 20 to 24 years
In terms of unemployment among ages 20 to 24 years, the demographic groups most similar to Immigrants from China are Hawaiian (10.4%, a difference of 0.050%), Immigrants from Russia (10.4%, a difference of 0.080%), Immigrants from Western Europe (10.4%, a difference of 0.10%), Guamanian/Chamorro (10.4%, a difference of 0.11%), and Syrian (10.4%, a difference of 0.12%).
| Demographics | Rating | Rank | Unemployment Among Ages 20 to 24 years |
| Immigrants | Egypt | 37.4 /100 | #183 | Fair 10.4% |
| Greeks | 37.2 /100 | #184 | Fair 10.4% |
| Syrians | 35.6 /100 | #185 | Fair 10.4% |
| Guamanians/Chamorros | 35.4 /100 | #186 | Fair 10.4% |
| Immigrants | Western Europe | 35.0 /100 | #187 | Fair 10.4% |
| Immigrants | Russia | 34.6 /100 | #188 | Fair 10.4% |
| Hawaiians | 33.9 /100 | #189 | Fair 10.4% |
| Immigrants | China | 32.6 /100 | #190 | Fair 10.4% |
| Immigrants | Eastern Europe | 25.8 /100 | #191 | Fair 10.4% |
| Ugandans | 25.7 /100 | #192 | Fair 10.4% |
| Immigrants | Portugal | 25.3 /100 | #193 | Fair 10.4% |
| Immigrants | Italy | 25.0 /100 | #194 | Fair 10.4% |
| Egyptians | 24.5 /100 | #195 | Fair 10.4% |
| Immigrants | Philippines | 24.1 /100 | #196 | Fair 10.4% |
| Immigrants | Denmark | 22.8 /100 | #197 | Fair 10.4% |
Demographics Similar to Hmong by Unemployment Among Ages 20 to 24 years
In terms of unemployment among ages 20 to 24 years, the demographic groups most similar to Hmong are Osage (9.4%, a difference of 0.010%), Immigrants from Bosnia and Herzegovina (9.4%, a difference of 0.010%), Chinese (9.4%, a difference of 0.12%), Tongan (9.4%, a difference of 0.28%), and Immigrants from Nepal (9.4%, a difference of 0.29%).
| Demographics | Rating | Rank | Unemployment Among Ages 20 to 24 years |
| Cubans | 100.0 /100 | #12 | Exceptional 9.2% |
| Immigrants | Congo | 100.0 /100 | #13 | Exceptional 9.2% |
| Slovenes | 100.0 /100 | #14 | Exceptional 9.3% |
| Immigrants | Sudan | 100.0 /100 | #15 | Exceptional 9.3% |
| Danes | 100.0 /100 | #16 | Exceptional 9.3% |
| Czechs | 100.0 /100 | #17 | Exceptional 9.3% |
| Chinese | 100.0 /100 | #18 | Exceptional 9.4% |
| Hmong | 100.0 /100 | #19 | Exceptional 9.4% |
| Osage | 100.0 /100 | #20 | Exceptional 9.4% |
| Immigrants | Bosnia and Herzegovina | 100.0 /100 | #21 | Exceptional 9.4% |
| Tongans | 100.0 /100 | #22 | Exceptional 9.4% |
| Immigrants | Nepal | 100.0 /100 | #23 | Exceptional 9.4% |
| Taiwanese | 100.0 /100 | #24 | Exceptional 9.4% |
| Immigrants | Eritrea | 100.0 /100 | #25 | Exceptional 9.5% |
| Swedes | 100.0 /100 | #26 | Exceptional 9.5% |