Immigrants from China vs Immigrants from the Azores Unemployment Among Ages 20 to 24 years
COMPARE
Immigrants from China
Immigrants from the Azores
Unemployment Among Ages 20 to 24 years
Unemployment Among Ages 20 to 24 years Comparison
Immigrants from China
Immigrants from the Azores
10.4%
UNEMPLOYMENT AMONG AGES 20 TO 24 YEARS
32.6/ 100
METRIC RATING
190th/ 347
METRIC RANK
10.2%
UNEMPLOYMENT AMONG AGES 20 TO 24 YEARS
81.4/ 100
METRIC RATING
141st/ 347
METRIC RANK
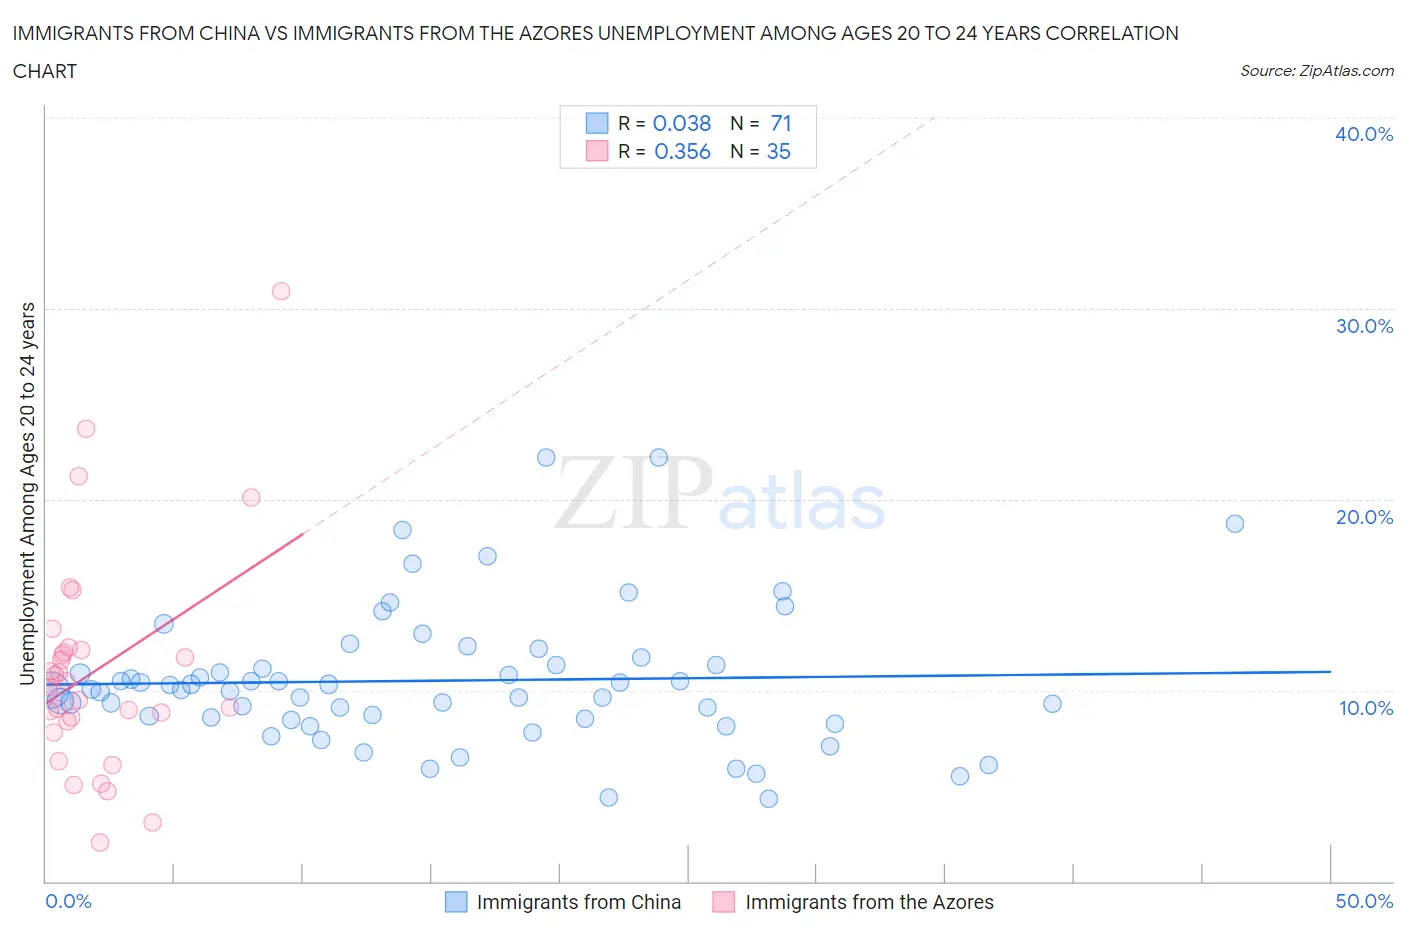
Immigrants from China vs Immigrants from the Azores Unemployment Among Ages 20 to 24 years Correlation Chart
The statistical analysis conducted on geographies consisting of 439,768,466 people shows no correlation between the proportion of Immigrants from China and unemployment rate among population between the ages 20 and 24 in the United States with a correlation coefficient (R) of 0.038 and weighted average of 10.4%. Similarly, the statistical analysis conducted on geographies consisting of 45,705,987 people shows a mild positive correlation between the proportion of Immigrants from the Azores and unemployment rate among population between the ages 20 and 24 in the United States with a correlation coefficient (R) of 0.356 and weighted average of 10.2%, a difference of 2.1%.
Unemployment Among Ages 20 to 24 years Correlation Summary
| Measurement | Immigrants from China | Immigrants from the Azores |
| Minimum | 4.3% | 2.0% |
| Maximum | 22.2% | 30.9% |
| Range | 17.9% | 28.9% |
| Mean | 10.5% | 11.0% |
| Median | 10.0% | 10.2% |
| Interquartile 25% (IQ1) | 8.5% | 8.4% |
| Interquartile 75% (IQ3) | 11.3% | 12.1% |
| Interquartile Range (IQR) | 2.8% | 3.7% |
| Standard Deviation (Sample) | 3.6% | 5.8% |
| Standard Deviation (Population) | 3.6% | 5.7% |
Similar Demographics by Unemployment Among Ages 20 to 24 years
Demographics Similar to Immigrants from China by Unemployment Among Ages 20 to 24 years
In terms of unemployment among ages 20 to 24 years, the demographic groups most similar to Immigrants from China are Hawaiian (10.4%, a difference of 0.050%), Immigrants from Russia (10.4%, a difference of 0.080%), Immigrants from Western Europe (10.4%, a difference of 0.10%), Guamanian/Chamorro (10.4%, a difference of 0.11%), and Syrian (10.4%, a difference of 0.12%).
| Demographics | Rating | Rank | Unemployment Among Ages 20 to 24 years |
| Immigrants | Egypt | 37.4 /100 | #183 | Fair 10.4% |
| Greeks | 37.2 /100 | #184 | Fair 10.4% |
| Syrians | 35.6 /100 | #185 | Fair 10.4% |
| Guamanians/Chamorros | 35.4 /100 | #186 | Fair 10.4% |
| Immigrants | Western Europe | 35.0 /100 | #187 | Fair 10.4% |
| Immigrants | Russia | 34.6 /100 | #188 | Fair 10.4% |
| Hawaiians | 33.9 /100 | #189 | Fair 10.4% |
| Immigrants | China | 32.6 /100 | #190 | Fair 10.4% |
| Immigrants | Eastern Europe | 25.8 /100 | #191 | Fair 10.4% |
| Ugandans | 25.7 /100 | #192 | Fair 10.4% |
| Immigrants | Portugal | 25.3 /100 | #193 | Fair 10.4% |
| Immigrants | Italy | 25.0 /100 | #194 | Fair 10.4% |
| Egyptians | 24.5 /100 | #195 | Fair 10.4% |
| Immigrants | Philippines | 24.1 /100 | #196 | Fair 10.4% |
| Immigrants | Denmark | 22.8 /100 | #197 | Fair 10.4% |
Demographics Similar to Immigrants from the Azores by Unemployment Among Ages 20 to 24 years
In terms of unemployment among ages 20 to 24 years, the demographic groups most similar to Immigrants from the Azores are Immigrants from Austria (10.2%, a difference of 0.0%), Uruguayan (10.2%, a difference of 0.030%), Burmese (10.2%, a difference of 0.060%), Immigrants from Northern Africa (10.2%, a difference of 0.070%), and Immigrants from North America (10.2%, a difference of 0.070%).
| Demographics | Rating | Rank | Unemployment Among Ages 20 to 24 years |
| Romanians | 83.8 /100 | #134 | Excellent 10.2% |
| Comanche | 83.4 /100 | #135 | Excellent 10.2% |
| Immigrants | Northern Africa | 82.5 /100 | #136 | Excellent 10.2% |
| Immigrants | North America | 82.5 /100 | #137 | Excellent 10.2% |
| Burmese | 82.3 /100 | #138 | Excellent 10.2% |
| Uruguayans | 81.9 /100 | #139 | Excellent 10.2% |
| Immigrants | Austria | 81.4 /100 | #140 | Excellent 10.2% |
| Immigrants | Azores | 81.4 /100 | #141 | Excellent 10.2% |
| Slovaks | 80.2 /100 | #142 | Excellent 10.2% |
| Immigrants | Jordan | 79.0 /100 | #143 | Good 10.2% |
| Brazilians | 78.4 /100 | #144 | Good 10.2% |
| Argentineans | 78.0 /100 | #145 | Good 10.2% |
| Asians | 77.7 /100 | #146 | Good 10.2% |
| French Canadians | 77.5 /100 | #147 | Good 10.2% |
| Immigrants | Romania | 75.7 /100 | #148 | Good 10.2% |