Immigrants from China vs Immigrants from Canada Unemployment Among Ages 20 to 24 years
COMPARE
Immigrants from China
Immigrants from Canada
Unemployment Among Ages 20 to 24 years
Unemployment Among Ages 20 to 24 years Comparison
Immigrants from China
Immigrants from Canada
10.4%
UNEMPLOYMENT AMONG AGES 20 TO 24 YEARS
32.6/ 100
METRIC RATING
190th/ 347
METRIC RANK
10.1%
UNEMPLOYMENT AMONG AGES 20 TO 24 YEARS
88.2/ 100
METRIC RATING
120th/ 347
METRIC RANK
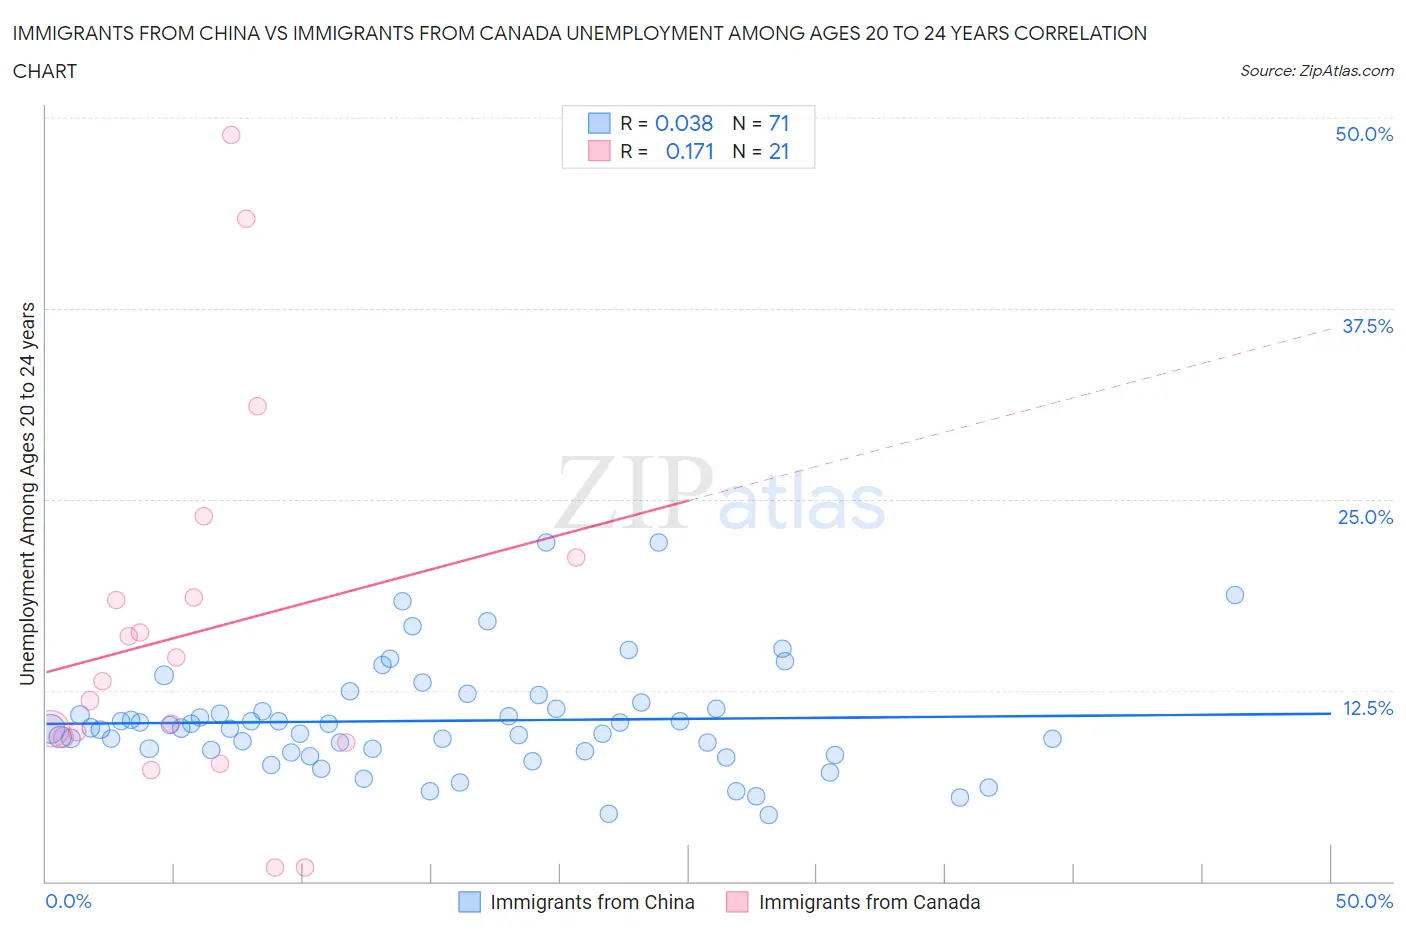
Immigrants from China vs Immigrants from Canada Unemployment Among Ages 20 to 24 years Correlation Chart
The statistical analysis conducted on geographies consisting of 439,768,466 people shows no correlation between the proportion of Immigrants from China and unemployment rate among population between the ages 20 and 24 in the United States with a correlation coefficient (R) of 0.038 and weighted average of 10.4%. Similarly, the statistical analysis conducted on geographies consisting of 438,067,925 people shows a poor positive correlation between the proportion of Immigrants from Canada and unemployment rate among population between the ages 20 and 24 in the United States with a correlation coefficient (R) of 0.171 and weighted average of 10.1%, a difference of 2.6%.
Unemployment Among Ages 20 to 24 years Correlation Summary
| Measurement | Immigrants from China | Immigrants from Canada |
| Minimum | 4.3% | 0.90% |
| Maximum | 22.2% | 48.8% |
| Range | 17.9% | 47.9% |
| Mean | 10.5% | 16.3% |
| Median | 10.0% | 13.1% |
| Interquartile 25% (IQ1) | 8.5% | 9.3% |
| Interquartile 75% (IQ3) | 11.3% | 19.9% |
| Interquartile Range (IQR) | 2.8% | 10.6% |
| Standard Deviation (Sample) | 3.6% | 12.2% |
| Standard Deviation (Population) | 3.6% | 11.9% |
Similar Demographics by Unemployment Among Ages 20 to 24 years
Demographics Similar to Immigrants from China by Unemployment Among Ages 20 to 24 years
In terms of unemployment among ages 20 to 24 years, the demographic groups most similar to Immigrants from China are Hawaiian (10.4%, a difference of 0.050%), Immigrants from Russia (10.4%, a difference of 0.080%), Immigrants from Western Europe (10.4%, a difference of 0.10%), Guamanian/Chamorro (10.4%, a difference of 0.11%), and Syrian (10.4%, a difference of 0.12%).
| Demographics | Rating | Rank | Unemployment Among Ages 20 to 24 years |
| Immigrants | Egypt | 37.4 /100 | #183 | Fair 10.4% |
| Greeks | 37.2 /100 | #184 | Fair 10.4% |
| Syrians | 35.6 /100 | #185 | Fair 10.4% |
| Guamanians/Chamorros | 35.4 /100 | #186 | Fair 10.4% |
| Immigrants | Western Europe | 35.0 /100 | #187 | Fair 10.4% |
| Immigrants | Russia | 34.6 /100 | #188 | Fair 10.4% |
| Hawaiians | 33.9 /100 | #189 | Fair 10.4% |
| Immigrants | China | 32.6 /100 | #190 | Fair 10.4% |
| Immigrants | Eastern Europe | 25.8 /100 | #191 | Fair 10.4% |
| Ugandans | 25.7 /100 | #192 | Fair 10.4% |
| Immigrants | Portugal | 25.3 /100 | #193 | Fair 10.4% |
| Immigrants | Italy | 25.0 /100 | #194 | Fair 10.4% |
| Egyptians | 24.5 /100 | #195 | Fair 10.4% |
| Immigrants | Philippines | 24.1 /100 | #196 | Fair 10.4% |
| Immigrants | Denmark | 22.8 /100 | #197 | Fair 10.4% |
Demographics Similar to Immigrants from Canada by Unemployment Among Ages 20 to 24 years
In terms of unemployment among ages 20 to 24 years, the demographic groups most similar to Immigrants from Canada are French (10.1%, a difference of 0.0%), South African (10.1%, a difference of 0.030%), Paraguayan (10.1%, a difference of 0.040%), White/Caucasian (10.1%, a difference of 0.070%), and Immigrants from Iraq (10.1%, a difference of 0.10%).
| Demographics | Rating | Rank | Unemployment Among Ages 20 to 24 years |
| German Russians | 92.4 /100 | #113 | Exceptional 10.1% |
| Ottawa | 90.8 /100 | #114 | Exceptional 10.1% |
| Immigrants | Morocco | 90.5 /100 | #115 | Exceptional 10.1% |
| Basques | 89.8 /100 | #116 | Excellent 10.1% |
| Immigrants | Uruguay | 89.6 /100 | #117 | Excellent 10.1% |
| Paraguayans | 88.6 /100 | #118 | Excellent 10.1% |
| French | 88.2 /100 | #119 | Excellent 10.1% |
| Immigrants | Canada | 88.2 /100 | #120 | Excellent 10.1% |
| South Africans | 87.8 /100 | #121 | Excellent 10.1% |
| Whites/Caucasians | 87.4 /100 | #122 | Excellent 10.1% |
| Immigrants | Iraq | 87.1 /100 | #123 | Excellent 10.1% |
| Immigrants | Japan | 86.5 /100 | #124 | Excellent 10.1% |
| Spanish | 86.1 /100 | #125 | Excellent 10.1% |
| Jordanians | 86.1 /100 | #126 | Excellent 10.1% |
| Immigrants | Norway | 85.3 /100 | #127 | Excellent 10.1% |