Immigrants from Chile vs Immigrants from Brazil Unemployment Among Seniors over 65 years
COMPARE
Immigrants from Chile
Immigrants from Brazil
Unemployment Among Seniors over 65 years
Unemployment Among Seniors over 65 years Comparison
Immigrants from Chile
Immigrants from Brazil
5.1%
UNEMPLOYMENT AMONG SENIORS OVER 65 YEARS
83.0/ 100
METRIC RATING
140th/ 347
METRIC RANK
5.4%
UNEMPLOYMENT AMONG SENIORS OVER 65 YEARS
0.1/ 100
METRIC RATING
274th/ 347
METRIC RANK
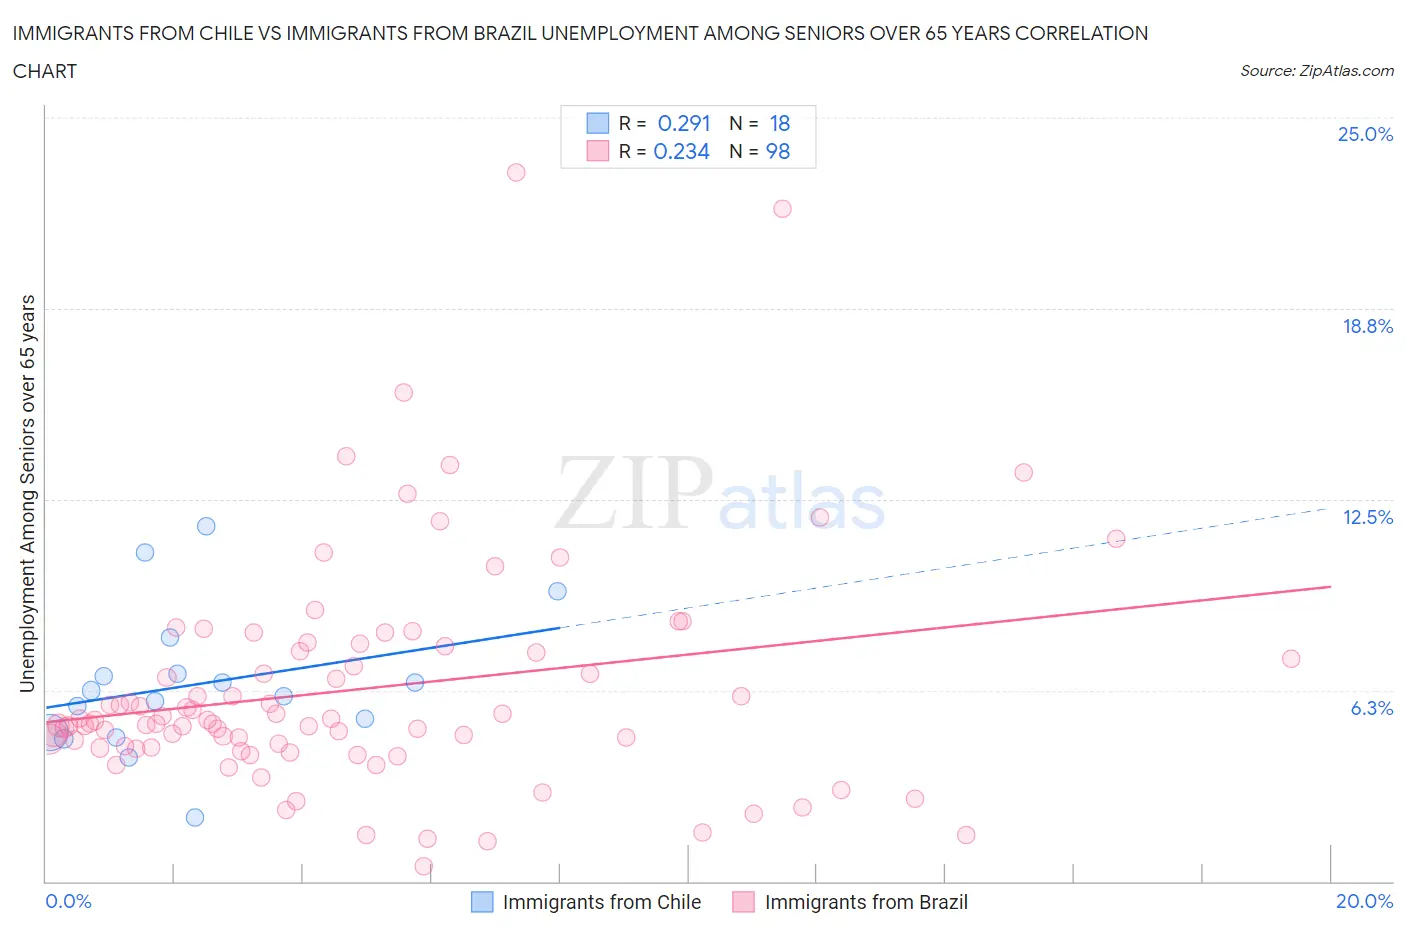
Immigrants from Chile vs Immigrants from Brazil Unemployment Among Seniors over 65 years Correlation Chart
The statistical analysis conducted on geographies consisting of 207,338,369 people shows a weak positive correlation between the proportion of Immigrants from Chile and unemployment rate amomg seniors over the age of 65 in the United States with a correlation coefficient (R) of 0.291 and weighted average of 5.1%. Similarly, the statistical analysis conducted on geographies consisting of 316,177,554 people shows a weak positive correlation between the proportion of Immigrants from Brazil and unemployment rate amomg seniors over the age of 65 in the United States with a correlation coefficient (R) of 0.234 and weighted average of 5.4%, a difference of 6.8%.
Unemployment Among Seniors over 65 years Correlation Summary
| Measurement | Immigrants from Chile | Immigrants from Brazil |
| Minimum | 2.1% | 0.50% |
| Maximum | 11.6% | 23.2% |
| Range | 9.5% | 22.7% |
| Mean | 6.4% | 6.3% |
| Median | 6.2% | 5.2% |
| Interquartile 25% (IQ1) | 4.9% | 4.4% |
| Interquartile 75% (IQ3) | 6.8% | 7.5% |
| Interquartile Range (IQR) | 1.9% | 3.2% |
| Standard Deviation (Sample) | 2.3% | 3.8% |
| Standard Deviation (Population) | 2.3% | 3.8% |
Similar Demographics by Unemployment Among Seniors over 65 years
Demographics Similar to Immigrants from Chile by Unemployment Among Seniors over 65 years
In terms of unemployment among seniors over 65 years, the demographic groups most similar to Immigrants from Chile are Immigrants from Panama (5.1%, a difference of 0.0%), New Zealander (5.1%, a difference of 0.020%), White/Caucasian (5.1%, a difference of 0.080%), Arab (5.1%, a difference of 0.080%), and Cherokee (5.1%, a difference of 0.080%).
| Demographics | Rating | Rank | Unemployment Among Seniors over 65 years |
| Syrians | 85.3 /100 | #133 | Excellent 5.1% |
| Turks | 84.9 /100 | #134 | Excellent 5.1% |
| Ukrainians | 84.4 /100 | #135 | Excellent 5.1% |
| Whites/Caucasians | 84.4 /100 | #136 | Excellent 5.1% |
| Arabs | 84.3 /100 | #137 | Excellent 5.1% |
| New Zealanders | 83.2 /100 | #138 | Excellent 5.1% |
| Immigrants | Panama | 83.0 /100 | #139 | Excellent 5.1% |
| Immigrants | Chile | 83.0 /100 | #140 | Excellent 5.1% |
| Cherokee | 81.6 /100 | #141 | Excellent 5.1% |
| Immigrants | Indonesia | 81.0 /100 | #142 | Excellent 5.1% |
| Senegalese | 80.4 /100 | #143 | Excellent 5.1% |
| Poles | 80.3 /100 | #144 | Excellent 5.1% |
| Spanish | 78.8 /100 | #145 | Good 5.1% |
| Immigrants | Russia | 78.5 /100 | #146 | Good 5.1% |
| Slovaks | 77.9 /100 | #147 | Good 5.1% |
Demographics Similar to Immigrants from Brazil by Unemployment Among Seniors over 65 years
In terms of unemployment among seniors over 65 years, the demographic groups most similar to Immigrants from Brazil are Immigrants from Nigeria (5.4%, a difference of 0.040%), Cypriot (5.4%, a difference of 0.050%), Immigrants from Jamaica (5.4%, a difference of 0.050%), Immigrants from Morocco (5.4%, a difference of 0.070%), and Immigrants from Southern Europe (5.4%, a difference of 0.13%).
| Demographics | Rating | Rank | Unemployment Among Seniors over 65 years |
| Chippewa | 0.2 /100 | #267 | Tragic 5.4% |
| Hawaiians | 0.1 /100 | #268 | Tragic 5.4% |
| Immigrants | Southern Europe | 0.1 /100 | #269 | Tragic 5.4% |
| Immigrants | Morocco | 0.1 /100 | #270 | Tragic 5.4% |
| Cypriots | 0.1 /100 | #271 | Tragic 5.4% |
| Immigrants | Jamaica | 0.1 /100 | #272 | Tragic 5.4% |
| Immigrants | Nigeria | 0.1 /100 | #273 | Tragic 5.4% |
| Immigrants | Brazil | 0.1 /100 | #274 | Tragic 5.4% |
| Mexican American Indians | 0.1 /100 | #275 | Tragic 5.4% |
| Pueblo | 0.1 /100 | #276 | Tragic 5.4% |
| Immigrants | Western Africa | 0.1 /100 | #277 | Tragic 5.4% |
| Colville | 0.1 /100 | #278 | Tragic 5.4% |
| Brazilians | 0.1 /100 | #279 | Tragic 5.5% |
| Immigrants | South America | 0.1 /100 | #280 | Tragic 5.5% |
| Immigrants | Norway | 0.0 /100 | #281 | Tragic 5.5% |