Immigrants from Central America vs Paraguayan Male Unemployment
COMPARE
Immigrants from Central America
Paraguayan
Male Unemployment
Male Unemployment Comparison
Immigrants from Central America
Paraguayans
5.8%
MALE UNEMPLOYMENT
0.1/ 100
METRIC RATING
260th/ 347
METRIC RANK
4.9%
MALE UNEMPLOYMENT
99.5/ 100
METRIC RATING
35th/ 347
METRIC RANK
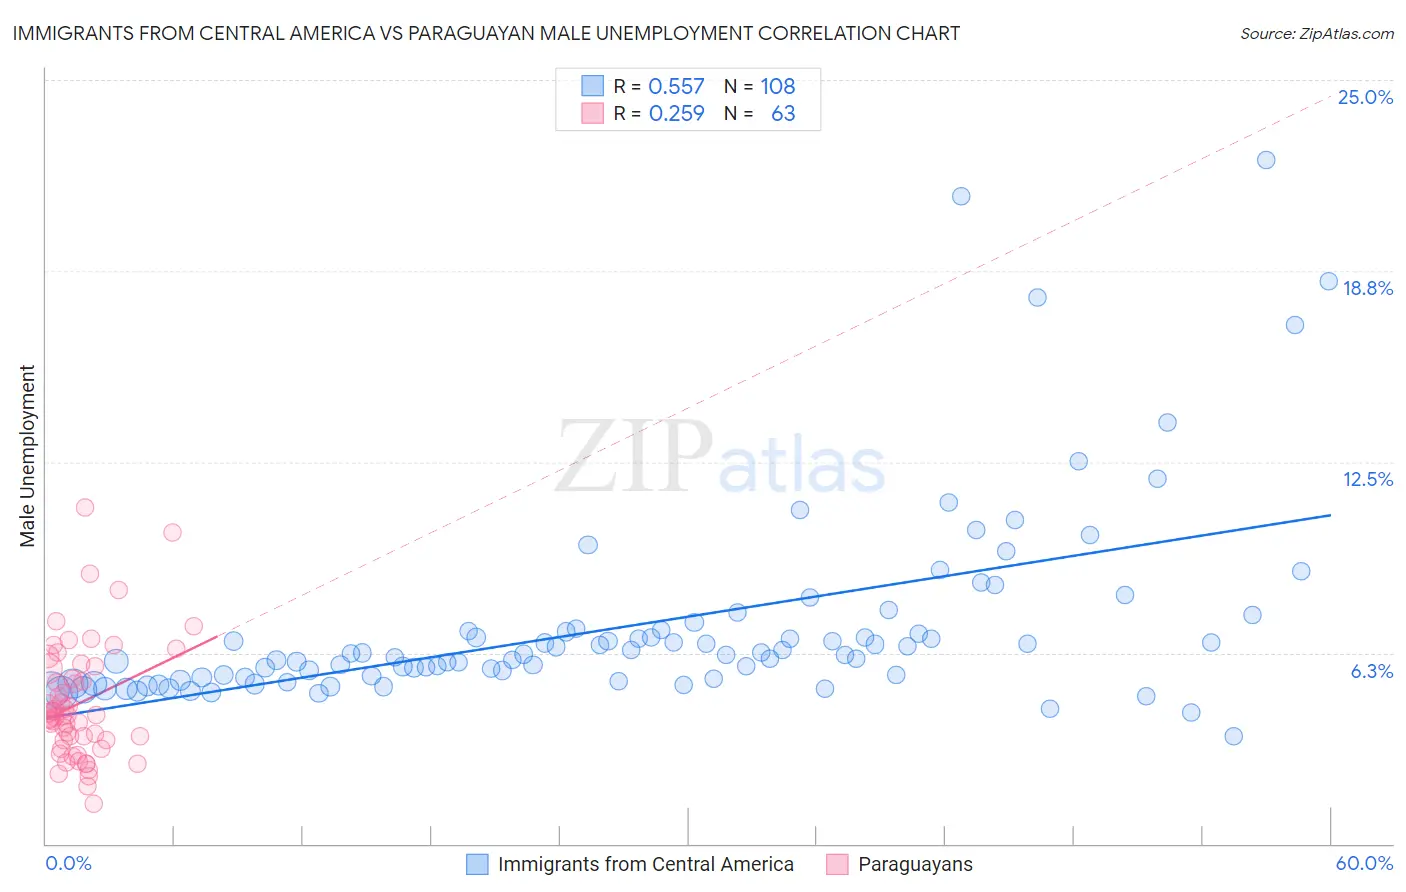
Immigrants from Central America vs Paraguayan Male Unemployment Correlation Chart
The statistical analysis conducted on geographies consisting of 529,817,546 people shows a substantial positive correlation between the proportion of Immigrants from Central America and unemployment rate among males in the United States with a correlation coefficient (R) of 0.557 and weighted average of 5.8%. Similarly, the statistical analysis conducted on geographies consisting of 95,072,234 people shows a weak positive correlation between the proportion of Paraguayans and unemployment rate among males in the United States with a correlation coefficient (R) of 0.259 and weighted average of 4.9%, a difference of 19.1%.
Male Unemployment Correlation Summary
| Measurement | Immigrants from Central America | Paraguayan |
| Minimum | 3.5% | 1.3% |
| Maximum | 22.4% | 11.0% |
| Range | 18.9% | 9.7% |
| Mean | 7.2% | 4.6% |
| Median | 6.2% | 4.2% |
| Interquartile 25% (IQ1) | 5.4% | 3.4% |
| Interquartile 75% (IQ3) | 7.0% | 5.7% |
| Interquartile Range (IQR) | 1.6% | 2.3% |
| Standard Deviation (Sample) | 3.3% | 1.9% |
| Standard Deviation (Population) | 3.2% | 1.9% |
Similar Demographics by Male Unemployment
Demographics Similar to Immigrants from Central America by Male Unemployment
In terms of male unemployment, the demographic groups most similar to Immigrants from Central America are Cajun (5.8%, a difference of 0.060%), Liberian (5.8%, a difference of 0.18%), Dutch West Indian (5.8%, a difference of 0.21%), Hispanic or Latino (5.8%, a difference of 0.35%), and Comanche (5.8%, a difference of 0.52%).
| Demographics | Rating | Rank | Male Unemployment |
| Mexican American Indians | 0.2 /100 | #253 | Tragic 5.8% |
| Japanese | 0.2 /100 | #254 | Tragic 5.8% |
| Kiowa | 0.2 /100 | #255 | Tragic 5.8% |
| Comanche | 0.2 /100 | #256 | Tragic 5.8% |
| Hispanics or Latinos | 0.1 /100 | #257 | Tragic 5.8% |
| Dutch West Indians | 0.1 /100 | #258 | Tragic 5.8% |
| Cajuns | 0.1 /100 | #259 | Tragic 5.8% |
| Immigrants | Central America | 0.1 /100 | #260 | Tragic 5.8% |
| Liberians | 0.1 /100 | #261 | Tragic 5.8% |
| Immigrants | Portugal | 0.1 /100 | #262 | Tragic 5.9% |
| Immigrants | Latin America | 0.1 /100 | #263 | Tragic 5.9% |
| Immigrants | Mexico | 0.0 /100 | #264 | Tragic 5.9% |
| French American Indians | 0.0 /100 | #265 | Tragic 5.9% |
| Bahamians | 0.0 /100 | #266 | Tragic 5.9% |
| Nigerians | 0.0 /100 | #267 | Tragic 5.9% |
Demographics Similar to Paraguayans by Male Unemployment
In terms of male unemployment, the demographic groups most similar to Paraguayans are Immigrants from Singapore (4.9%, a difference of 0.080%), Scotch-Irish (4.9%, a difference of 0.29%), Immigrants from Bosnia and Herzegovina (4.9%, a difference of 0.31%), Burmese (4.9%, a difference of 0.38%), and Northern European (4.9%, a difference of 0.46%).
| Demographics | Rating | Rank | Male Unemployment |
| Bulgarians | 99.8 /100 | #28 | Exceptional 4.8% |
| Scottish | 99.8 /100 | #29 | Exceptional 4.8% |
| British | 99.8 /100 | #30 | Exceptional 4.8% |
| Sudanese | 99.8 /100 | #31 | Exceptional 4.8% |
| Immigrants | Nepal | 99.8 /100 | #32 | Exceptional 4.8% |
| Latvians | 99.7 /100 | #33 | Exceptional 4.8% |
| Welsh | 99.7 /100 | #34 | Exceptional 4.8% |
| Paraguayans | 99.5 /100 | #35 | Exceptional 4.9% |
| Immigrants | Singapore | 99.4 /100 | #36 | Exceptional 4.9% |
| Scotch-Irish | 99.4 /100 | #37 | Exceptional 4.9% |
| Immigrants | Bosnia and Herzegovina | 99.4 /100 | #38 | Exceptional 4.9% |
| Burmese | 99.3 /100 | #39 | Exceptional 4.9% |
| Northern Europeans | 99.3 /100 | #40 | Exceptional 4.9% |
| Chinese | 99.3 /100 | #41 | Exceptional 4.9% |
| Immigrants | Belgium | 99.2 /100 | #42 | Exceptional 4.9% |