Immigrants from Central America vs Danish Unemployment Among Ages 30 to 34 years
COMPARE
Immigrants from Central America
Danish
Unemployment Among Ages 30 to 34 years
Unemployment Among Ages 30 to 34 years Comparison
Immigrants from Central America
Danes
6.2%
UNEMPLOYMENT AMONG AGES 30 TO 34 YEARS
0.1/ 100
METRIC RATING
262nd/ 347
METRIC RANK
5.0%
UNEMPLOYMENT AMONG AGES 30 TO 34 YEARS
99.5/ 100
METRIC RATING
27th/ 347
METRIC RANK
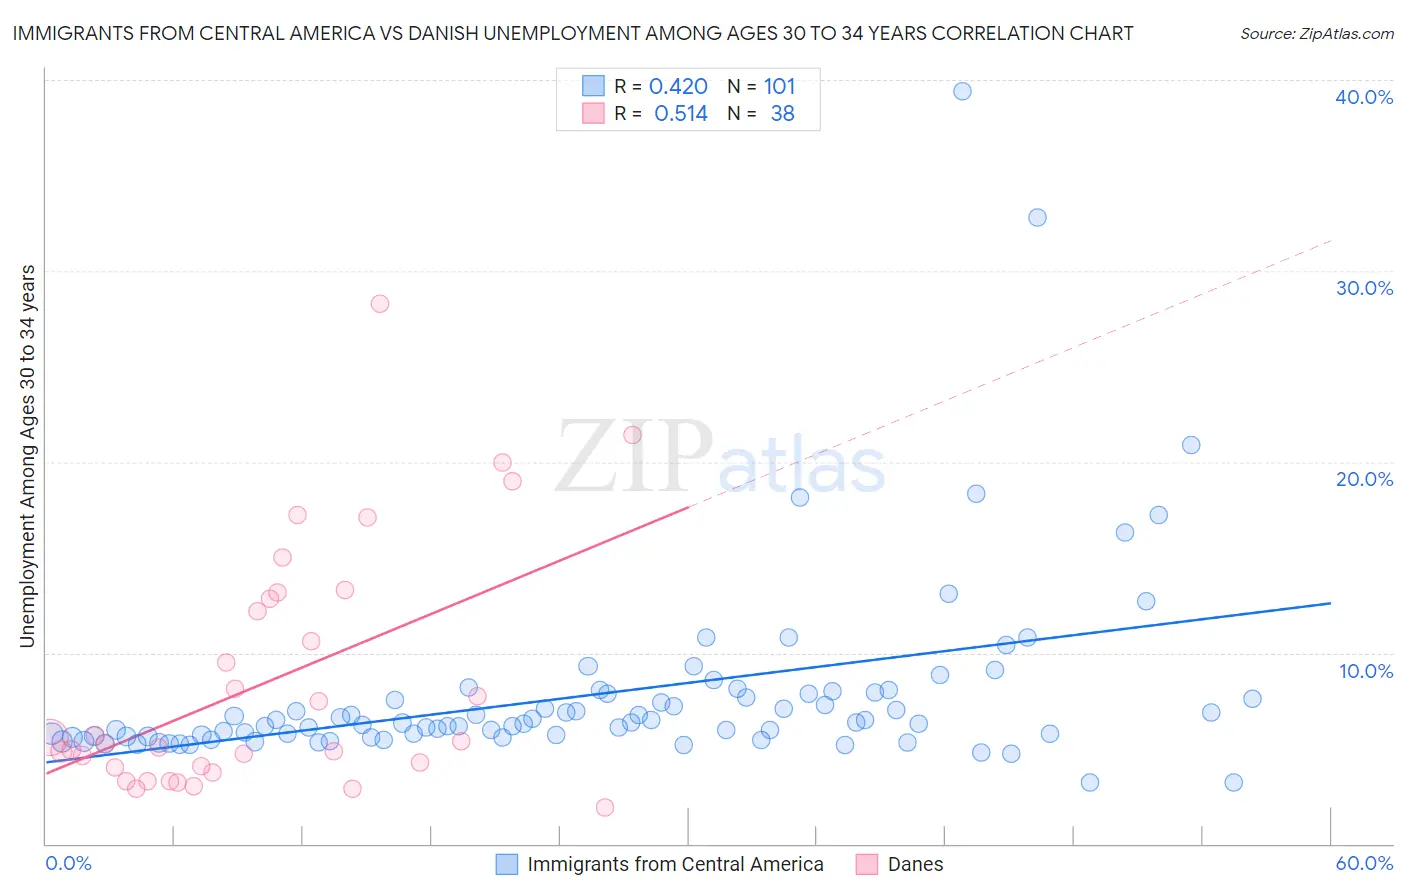
Immigrants from Central America vs Danish Unemployment Among Ages 30 to 34 years Correlation Chart
The statistical analysis conducted on geographies consisting of 481,234,417 people shows a moderate positive correlation between the proportion of Immigrants from Central America and unemployment rate among population between the ages 30 and 34 in the United States with a correlation coefficient (R) of 0.420 and weighted average of 6.2%. Similarly, the statistical analysis conducted on geographies consisting of 429,862,227 people shows a substantial positive correlation between the proportion of Danes and unemployment rate among population between the ages 30 and 34 in the United States with a correlation coefficient (R) of 0.514 and weighted average of 5.0%, a difference of 24.2%.
Unemployment Among Ages 30 to 34 years Correlation Summary
| Measurement | Immigrants from Central America | Danish |
| Minimum | 3.2% | 1.9% |
| Maximum | 39.4% | 28.3% |
| Range | 36.2% | 26.4% |
| Mean | 7.8% | 8.5% |
| Median | 6.3% | 5.3% |
| Interquartile 25% (IQ1) | 5.6% | 4.0% |
| Interquartile 75% (IQ3) | 7.9% | 12.8% |
| Interquartile Range (IQR) | 2.3% | 8.8% |
| Standard Deviation (Sample) | 5.1% | 6.4% |
| Standard Deviation (Population) | 5.0% | 6.3% |
Similar Demographics by Unemployment Among Ages 30 to 34 years
Demographics Similar to Immigrants from Central America by Unemployment Among Ages 30 to 34 years
In terms of unemployment among ages 30 to 34 years, the demographic groups most similar to Immigrants from Central America are Immigrants from Western Africa (6.2%, a difference of 0.18%), Immigrants from Latin America (6.1%, a difference of 0.33%), Spanish American (6.2%, a difference of 0.50%), Chickasaw (6.2%, a difference of 0.54%), and Haitian (6.1%, a difference of 0.55%).
| Demographics | Rating | Rank | Unemployment Among Ages 30 to 34 years |
| Immigrants | Portugal | 0.1 /100 | #255 | Tragic 6.1% |
| Immigrants | Ghana | 0.1 /100 | #256 | Tragic 6.1% |
| Immigrants | Sierra Leone | 0.1 /100 | #257 | Tragic 6.1% |
| Mexicans | 0.1 /100 | #258 | Tragic 6.1% |
| Haitians | 0.1 /100 | #259 | Tragic 6.1% |
| Immigrants | Latin America | 0.1 /100 | #260 | Tragic 6.1% |
| Immigrants | Western Africa | 0.1 /100 | #261 | Tragic 6.2% |
| Immigrants | Central America | 0.1 /100 | #262 | Tragic 6.2% |
| Spanish Americans | 0.0 /100 | #263 | Tragic 6.2% |
| Chickasaw | 0.0 /100 | #264 | Tragic 6.2% |
| Americans | 0.0 /100 | #265 | Tragic 6.2% |
| Seminole | 0.0 /100 | #266 | Tragic 6.2% |
| Immigrants | Mexico | 0.0 /100 | #267 | Tragic 6.2% |
| Immigrants | Haiti | 0.0 /100 | #268 | Tragic 6.2% |
| French American Indians | 0.0 /100 | #269 | Tragic 6.3% |
Demographics Similar to Danes by Unemployment Among Ages 30 to 34 years
In terms of unemployment among ages 30 to 34 years, the demographic groups most similar to Danes are Immigrants from Kuwait (5.0%, a difference of 0.11%), Immigrants from Cuba (5.0%, a difference of 0.24%), German Russian (5.0%, a difference of 0.26%), Immigrants from Singapore (5.0%, a difference of 0.27%), and Norwegian (5.0%, a difference of 0.28%).
| Demographics | Rating | Rank | Unemployment Among Ages 30 to 34 years |
| Immigrants | Taiwan | 99.8 /100 | #20 | Exceptional 4.9% |
| Ethiopians | 99.8 /100 | #21 | Exceptional 4.9% |
| Immigrants | South Central Asia | 99.8 /100 | #22 | Exceptional 4.9% |
| Hmong | 99.8 /100 | #23 | Exceptional 4.9% |
| Ugandans | 99.7 /100 | #24 | Exceptional 4.9% |
| Immigrants | Singapore | 99.5 /100 | #25 | Exceptional 5.0% |
| Immigrants | Kuwait | 99.5 /100 | #26 | Exceptional 5.0% |
| Danes | 99.5 /100 | #27 | Exceptional 5.0% |
| Immigrants | Cuba | 99.4 /100 | #28 | Exceptional 5.0% |
| German Russians | 99.4 /100 | #29 | Exceptional 5.0% |
| Norwegians | 99.4 /100 | #30 | Exceptional 5.0% |
| Somalis | 99.3 /100 | #31 | Exceptional 5.0% |
| Immigrants | Zaire | 99.3 /100 | #32 | Exceptional 5.0% |
| Immigrants | Saudi Arabia | 99.3 /100 | #33 | Exceptional 5.0% |
| Latvians | 99.3 /100 | #34 | Exceptional 5.0% |