Immigrants from Central America vs Mexican Unemployment Among Women with Children Ages 6 to 17 years
COMPARE
Immigrants from Central America
Mexican
Unemployment Among Women with Children Ages 6 to 17 years
Unemployment Among Women with Children Ages 6 to 17 years Comparison
Immigrants from Central America
Mexicans
9.5%
UNEMPLOYMENT AMONG WOMEN WITH CHILDREN AGES 6 TO 17 YEARS
0.6/ 100
METRIC RATING
259th/ 347
METRIC RANK
9.3%
UNEMPLOYMENT AMONG WOMEN WITH CHILDREN AGES 6 TO 17 YEARS
3.2/ 100
METRIC RATING
234th/ 347
METRIC RANK
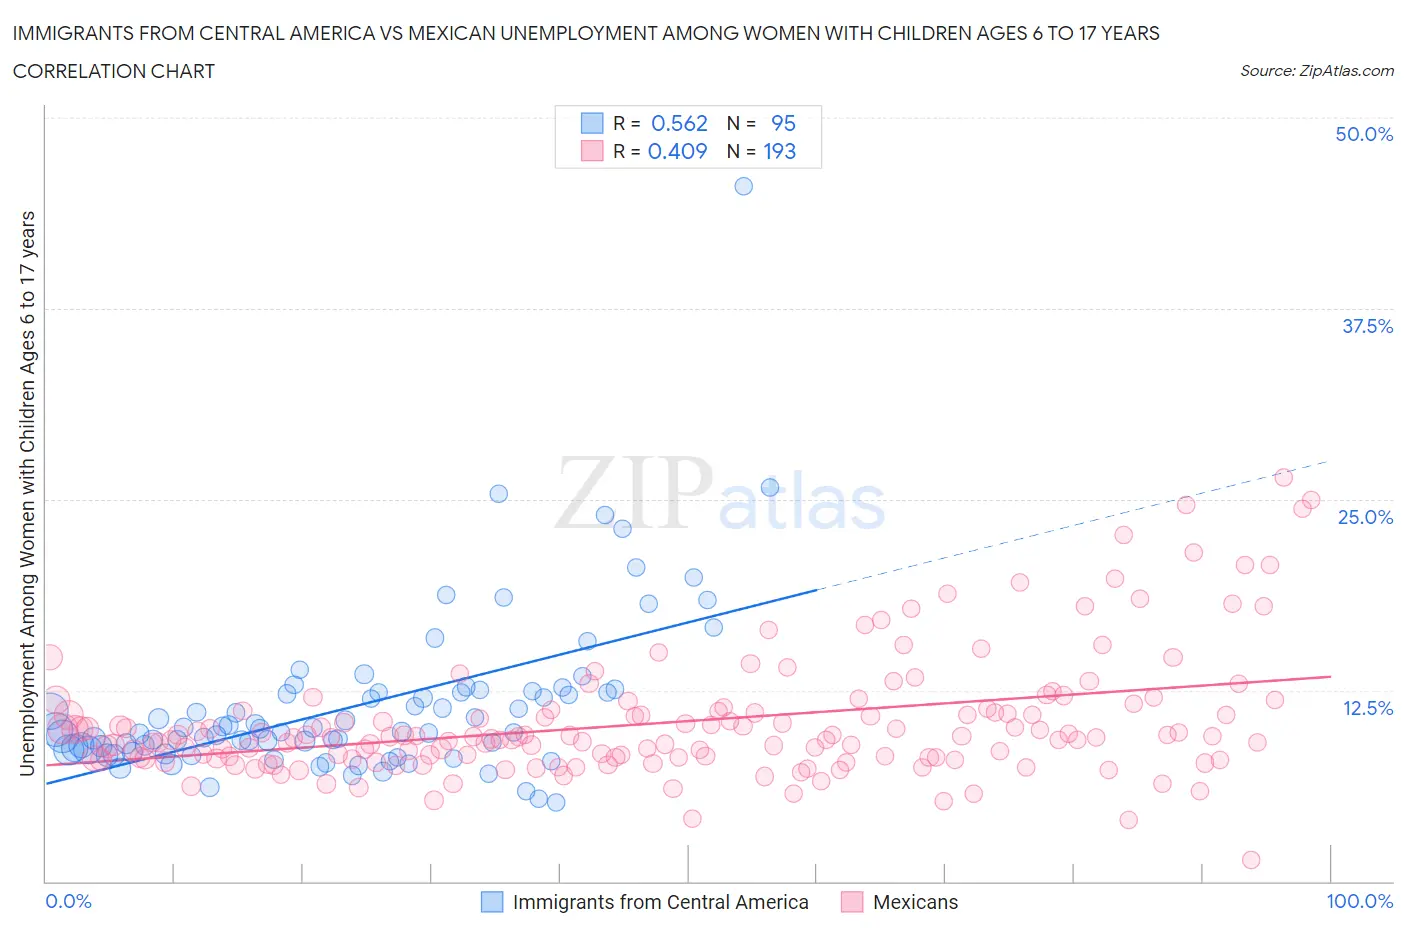
Immigrants from Central America vs Mexican Unemployment Among Women with Children Ages 6 to 17 years Correlation Chart
The statistical analysis conducted on geographies consisting of 349,954,771 people shows a substantial positive correlation between the proportion of Immigrants from Central America and unemployment rate among women with children between the ages 6 and 17 in the United States with a correlation coefficient (R) of 0.562 and weighted average of 9.5%. Similarly, the statistical analysis conducted on geographies consisting of 358,737,639 people shows a moderate positive correlation between the proportion of Mexicans and unemployment rate among women with children between the ages 6 and 17 in the United States with a correlation coefficient (R) of 0.409 and weighted average of 9.3%, a difference of 1.8%.
Unemployment Among Women with Children Ages 6 to 17 years Correlation Summary
| Measurement | Immigrants from Central America | Mexican |
| Minimum | 5.2% | 1.4% |
| Maximum | 45.5% | 26.5% |
| Range | 40.3% | 25.1% |
| Mean | 11.5% | 10.4% |
| Median | 9.8% | 9.4% |
| Interquartile 25% (IQ1) | 8.6% | 8.1% |
| Interquartile 75% (IQ3) | 12.4% | 11.2% |
| Interquartile Range (IQR) | 3.8% | 3.1% |
| Standard Deviation (Sample) | 5.5% | 4.0% |
| Standard Deviation (Population) | 5.5% | 4.0% |
Similar Demographics by Unemployment Among Women with Children Ages 6 to 17 years
Demographics Similar to Immigrants from Central America by Unemployment Among Women with Children Ages 6 to 17 years
In terms of unemployment among women with children ages 6 to 17 years, the demographic groups most similar to Immigrants from Central America are Immigrants from Mexico (9.5%, a difference of 0.090%), Italian (9.5%, a difference of 0.11%), Celtic (9.5%, a difference of 0.18%), South American (9.5%, a difference of 0.19%), and Canadian (9.4%, a difference of 0.20%).
| Demographics | Rating | Rank | Unemployment Among Women with Children Ages 6 to 17 years |
| Creek | 1.2 /100 | #252 | Tragic 9.4% |
| Portuguese | 1.1 /100 | #253 | Tragic 9.4% |
| Nicaraguans | 1.0 /100 | #254 | Tragic 9.4% |
| Lithuanians | 0.9 /100 | #255 | Tragic 9.4% |
| Canadians | 0.8 /100 | #256 | Tragic 9.4% |
| Celtics | 0.7 /100 | #257 | Tragic 9.5% |
| Immigrants | Mexico | 0.7 /100 | #258 | Tragic 9.5% |
| Immigrants | Central America | 0.6 /100 | #259 | Tragic 9.5% |
| Italians | 0.6 /100 | #260 | Tragic 9.5% |
| South Americans | 0.5 /100 | #261 | Tragic 9.5% |
| Senegalese | 0.5 /100 | #262 | Tragic 9.5% |
| Lebanese | 0.5 /100 | #263 | Tragic 9.5% |
| Immigrants | Ghana | 0.4 /100 | #264 | Tragic 9.5% |
| West Indians | 0.4 /100 | #265 | Tragic 9.5% |
| Immigrants | Jamaica | 0.3 /100 | #266 | Tragic 9.5% |
Demographics Similar to Mexicans by Unemployment Among Women with Children Ages 6 to 17 years
In terms of unemployment among women with children ages 6 to 17 years, the demographic groups most similar to Mexicans are Immigrants from St. Vincent and the Grenadines (9.3%, a difference of 0.030%), Uruguayan (9.3%, a difference of 0.070%), Hungarian (9.3%, a difference of 0.090%), Immigrants from Belize (9.3%, a difference of 0.14%), and French American Indian (9.3%, a difference of 0.15%).
| Demographics | Rating | Rank | Unemployment Among Women with Children Ages 6 to 17 years |
| Panamanians | 4.5 /100 | #227 | Tragic 9.3% |
| Estonians | 4.4 /100 | #228 | Tragic 9.3% |
| Lumbee | 4.3 /100 | #229 | Tragic 9.3% |
| Welsh | 4.0 /100 | #230 | Tragic 9.3% |
| Macedonians | 3.9 /100 | #231 | Tragic 9.3% |
| French American Indians | 3.7 /100 | #232 | Tragic 9.3% |
| Immigrants | St. Vincent and the Grenadines | 3.3 /100 | #233 | Tragic 9.3% |
| Mexicans | 3.2 /100 | #234 | Tragic 9.3% |
| Uruguayans | 3.0 /100 | #235 | Tragic 9.3% |
| Hungarians | 3.0 /100 | #236 | Tragic 9.3% |
| Immigrants | Belize | 2.8 /100 | #237 | Tragic 9.3% |
| Arabs | 2.7 /100 | #238 | Tragic 9.3% |
| Immigrants | Saudi Arabia | 2.7 /100 | #239 | Tragic 9.3% |
| Guatemalans | 2.3 /100 | #240 | Tragic 9.3% |
| Colombians | 2.2 /100 | #241 | Tragic 9.3% |