Somali vs Mexican Unemployment Among Women with Children Ages 6 to 17 years
COMPARE
Somali
Mexican
Unemployment Among Women with Children Ages 6 to 17 years
Unemployment Among Women with Children Ages 6 to 17 years Comparison
Somalis
Mexicans
8.0%
UNEMPLOYMENT AMONG WOMEN WITH CHILDREN AGES 6 TO 17 YEARS
100.0/ 100
METRIC RATING
39th/ 347
METRIC RANK
9.3%
UNEMPLOYMENT AMONG WOMEN WITH CHILDREN AGES 6 TO 17 YEARS
3.2/ 100
METRIC RATING
234th/ 347
METRIC RANK
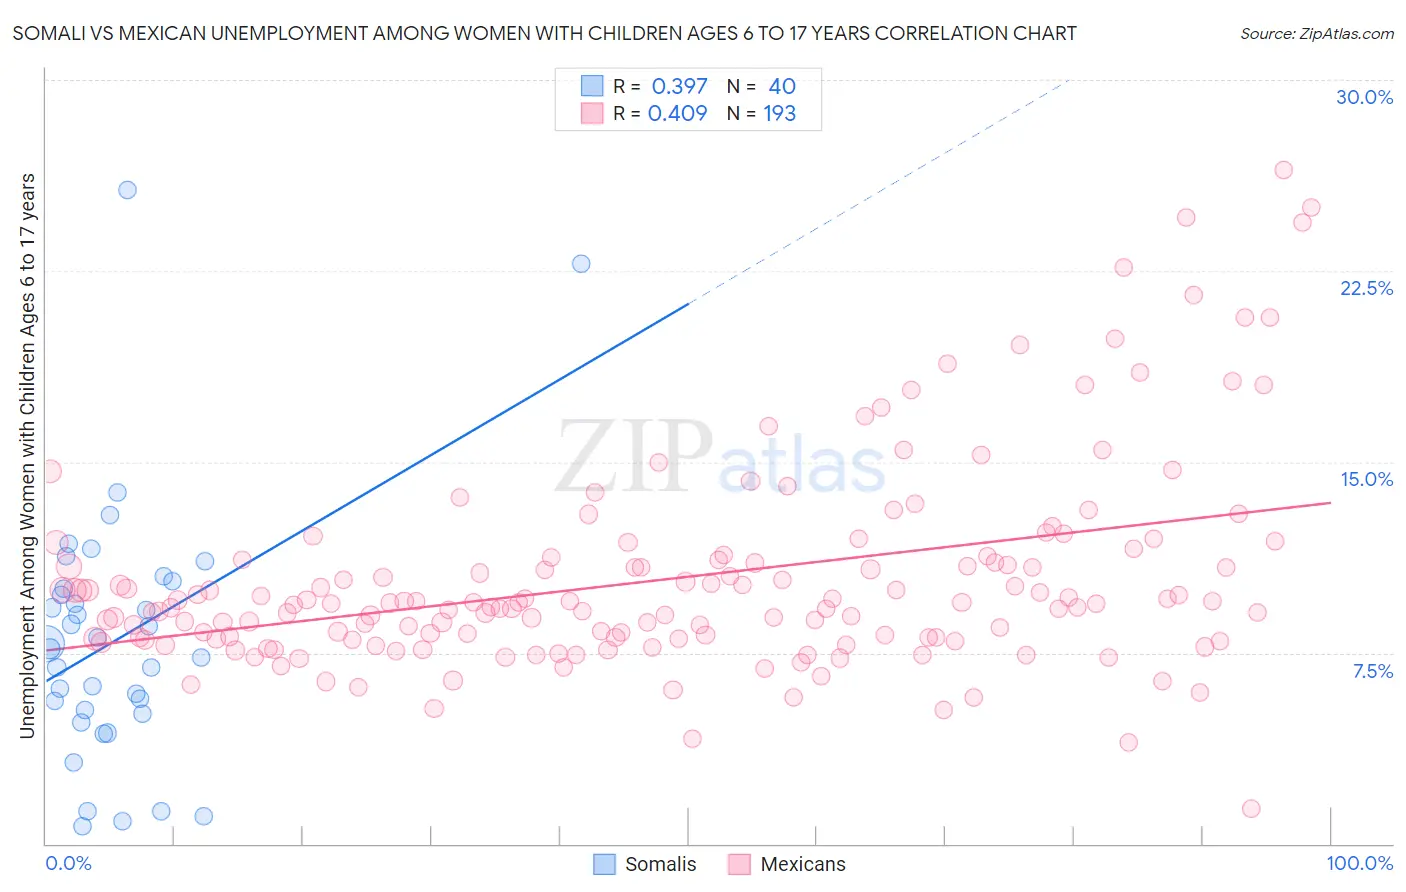
Somali vs Mexican Unemployment Among Women with Children Ages 6 to 17 years Correlation Chart
The statistical analysis conducted on geographies consisting of 87,159,329 people shows a mild positive correlation between the proportion of Somalis and unemployment rate among women with children between the ages 6 and 17 in the United States with a correlation coefficient (R) of 0.397 and weighted average of 8.0%. Similarly, the statistical analysis conducted on geographies consisting of 358,737,639 people shows a moderate positive correlation between the proportion of Mexicans and unemployment rate among women with children between the ages 6 and 17 in the United States with a correlation coefficient (R) of 0.409 and weighted average of 9.3%, a difference of 16.3%.
Unemployment Among Women with Children Ages 6 to 17 years Correlation Summary
| Measurement | Somali | Mexican |
| Minimum | 0.70% | 1.4% |
| Maximum | 25.7% | 26.5% |
| Range | 25.0% | 25.1% |
| Mean | 8.1% | 10.4% |
| Median | 7.8% | 9.4% |
| Interquartile 25% (IQ1) | 5.2% | 8.1% |
| Interquartile 75% (IQ3) | 10.2% | 11.2% |
| Interquartile Range (IQR) | 5.0% | 3.1% |
| Standard Deviation (Sample) | 5.1% | 4.0% |
| Standard Deviation (Population) | 5.0% | 4.0% |
Similar Demographics by Unemployment Among Women with Children Ages 6 to 17 years
Demographics Similar to Somalis by Unemployment Among Women with Children Ages 6 to 17 years
In terms of unemployment among women with children ages 6 to 17 years, the demographic groups most similar to Somalis are Alsatian (8.0%, a difference of 0.14%), Immigrants from Zimbabwe (8.0%, a difference of 0.29%), Iranian (8.0%, a difference of 0.36%), Asian (8.0%, a difference of 0.47%), and Burmese (8.0%, a difference of 0.51%).
| Demographics | Rating | Rank | Unemployment Among Women with Children Ages 6 to 17 years |
| Immigrants | Cambodia | 100.0 /100 | #32 | Exceptional 7.9% |
| Immigrants | Korea | 100.0 /100 | #33 | Exceptional 7.9% |
| Native Hawaiians | 100.0 /100 | #34 | Exceptional 7.9% |
| Immigrants | South Central Asia | 100.0 /100 | #35 | Exceptional 7.9% |
| Burmese | 100.0 /100 | #36 | Exceptional 8.0% |
| Asians | 100.0 /100 | #37 | Exceptional 8.0% |
| Alsatians | 100.0 /100 | #38 | Exceptional 8.0% |
| Somalis | 100.0 /100 | #39 | Exceptional 8.0% |
| Immigrants | Zimbabwe | 100.0 /100 | #40 | Exceptional 8.0% |
| Iranians | 100.0 /100 | #41 | Exceptional 8.0% |
| Immigrants | Somalia | 100.0 /100 | #42 | Exceptional 8.0% |
| Bhutanese | 100.0 /100 | #43 | Exceptional 8.1% |
| Immigrants | Sweden | 100.0 /100 | #44 | Exceptional 8.1% |
| Immigrants | Bulgaria | 100.0 /100 | #45 | Exceptional 8.1% |
| Icelanders | 100.0 /100 | #46 | Exceptional 8.1% |
Demographics Similar to Mexicans by Unemployment Among Women with Children Ages 6 to 17 years
In terms of unemployment among women with children ages 6 to 17 years, the demographic groups most similar to Mexicans are Immigrants from St. Vincent and the Grenadines (9.3%, a difference of 0.030%), Uruguayan (9.3%, a difference of 0.070%), Hungarian (9.3%, a difference of 0.090%), Immigrants from Belize (9.3%, a difference of 0.14%), and French American Indian (9.3%, a difference of 0.15%).
| Demographics | Rating | Rank | Unemployment Among Women with Children Ages 6 to 17 years |
| Panamanians | 4.5 /100 | #227 | Tragic 9.3% |
| Estonians | 4.4 /100 | #228 | Tragic 9.3% |
| Lumbee | 4.3 /100 | #229 | Tragic 9.3% |
| Welsh | 4.0 /100 | #230 | Tragic 9.3% |
| Macedonians | 3.9 /100 | #231 | Tragic 9.3% |
| French American Indians | 3.7 /100 | #232 | Tragic 9.3% |
| Immigrants | St. Vincent and the Grenadines | 3.3 /100 | #233 | Tragic 9.3% |
| Mexicans | 3.2 /100 | #234 | Tragic 9.3% |
| Uruguayans | 3.0 /100 | #235 | Tragic 9.3% |
| Hungarians | 3.0 /100 | #236 | Tragic 9.3% |
| Immigrants | Belize | 2.8 /100 | #237 | Tragic 9.3% |
| Arabs | 2.7 /100 | #238 | Tragic 9.3% |
| Immigrants | Saudi Arabia | 2.7 /100 | #239 | Tragic 9.3% |
| Guatemalans | 2.3 /100 | #240 | Tragic 9.3% |
| Colombians | 2.2 /100 | #241 | Tragic 9.3% |