Immigrants from Central America vs Chinese Unemployment Among Seniors over 65 years
COMPARE
Immigrants from Central America
Chinese
Unemployment Among Seniors over 65 years
Unemployment Among Seniors over 65 years Comparison
Immigrants from Central America
Chinese
5.7%
UNEMPLOYMENT AMONG SENIORS OVER 65 YEARS
0.0/ 100
METRIC RATING
316th/ 347
METRIC RANK
4.2%
UNEMPLOYMENT AMONG SENIORS OVER 65 YEARS
100.0/ 100
METRIC RATING
1st/ 347
METRIC RANK
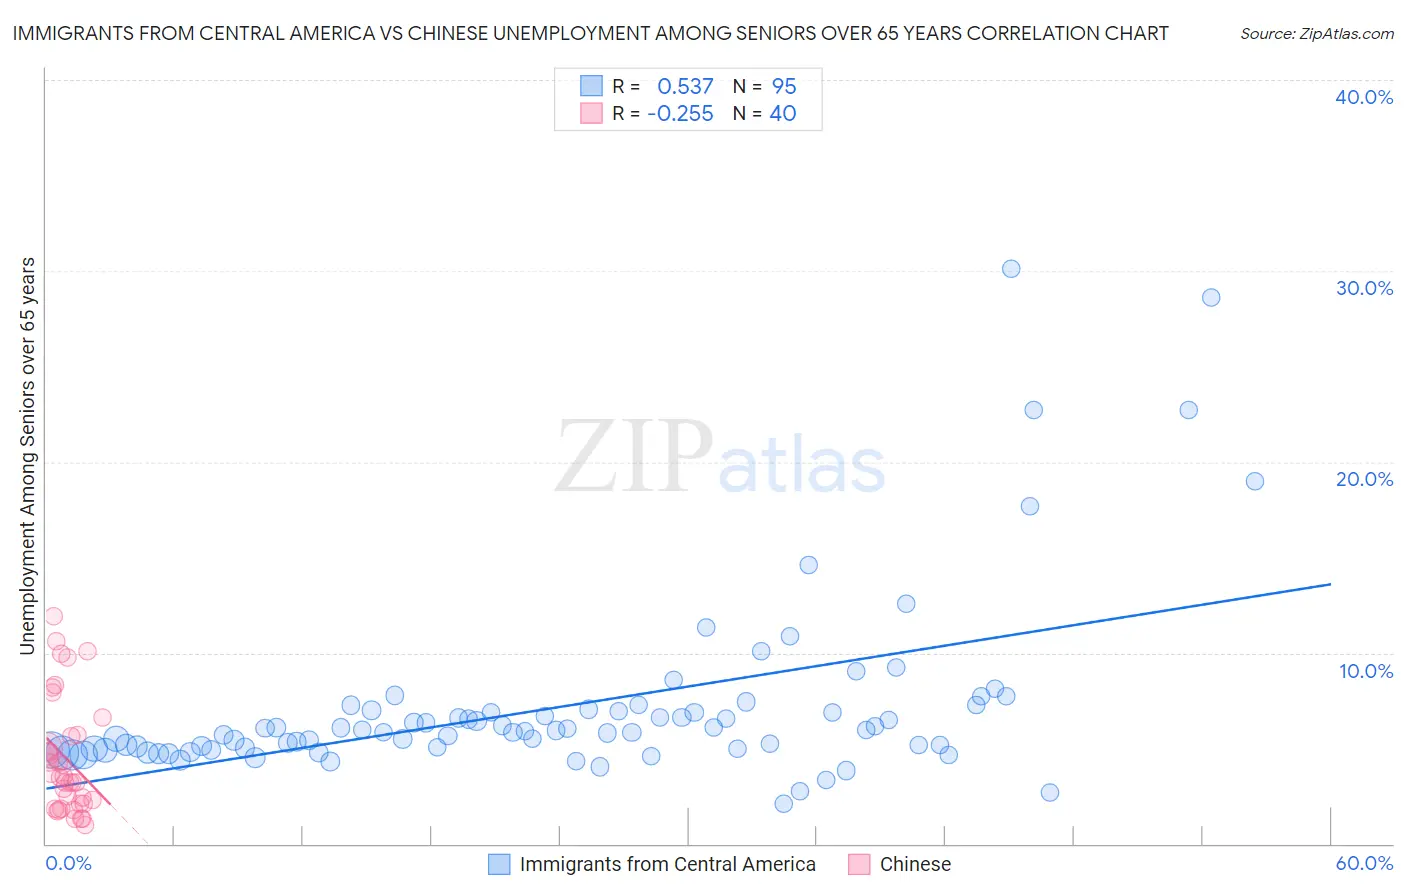
Immigrants from Central America vs Chinese Unemployment Among Seniors over 65 years Correlation Chart
The statistical analysis conducted on geographies consisting of 447,102,649 people shows a substantial positive correlation between the proportion of Immigrants from Central America and unemployment rate amomg seniors over the age of 65 in the United States with a correlation coefficient (R) of 0.537 and weighted average of 5.7%. Similarly, the statistical analysis conducted on geographies consisting of 62,562,312 people shows a weak negative correlation between the proportion of Chinese and unemployment rate amomg seniors over the age of 65 in the United States with a correlation coefficient (R) of -0.255 and weighted average of 4.2%, a difference of 35.4%.
Unemployment Among Seniors over 65 years Correlation Summary
| Measurement | Immigrants from Central America | Chinese |
| Minimum | 2.1% | 1.0% |
| Maximum | 30.1% | 11.9% |
| Range | 28.0% | 10.9% |
| Mean | 7.2% | 4.5% |
| Median | 5.9% | 3.5% |
| Interquartile 25% (IQ1) | 5.0% | 2.1% |
| Interquartile 75% (IQ3) | 7.0% | 5.7% |
| Interquartile Range (IQR) | 2.0% | 3.6% |
| Standard Deviation (Sample) | 4.8% | 3.0% |
| Standard Deviation (Population) | 4.8% | 2.9% |
Similar Demographics by Unemployment Among Seniors over 65 years
Demographics Similar to Immigrants from Central America by Unemployment Among Seniors over 65 years
In terms of unemployment among seniors over 65 years, the demographic groups most similar to Immigrants from Central America are Immigrants from Bahamas (5.7%, a difference of 0.12%), Immigrants from El Salvador (5.7%, a difference of 0.18%), Delaware (5.7%, a difference of 0.22%), Vietnamese (5.7%, a difference of 0.43%), and Immigrants from Bangladesh (5.7%, a difference of 0.66%).
| Demographics | Rating | Rank | Unemployment Among Seniors over 65 years |
| Immigrants | Guatemala | 0.0 /100 | #309 | Tragic 5.6% |
| Salvadorans | 0.0 /100 | #310 | Tragic 5.6% |
| Immigrants | Guyana | 0.0 /100 | #311 | Tragic 5.6% |
| Immigrants | Ecuador | 0.0 /100 | #312 | Tragic 5.6% |
| Barbadians | 0.0 /100 | #313 | Tragic 5.6% |
| Delaware | 0.0 /100 | #314 | Tragic 5.7% |
| Immigrants | El Salvador | 0.0 /100 | #315 | Tragic 5.7% |
| Immigrants | Central America | 0.0 /100 | #316 | Tragic 5.7% |
| Immigrants | Bahamas | 0.0 /100 | #317 | Tragic 5.7% |
| Vietnamese | 0.0 /100 | #318 | Tragic 5.7% |
| Immigrants | Bangladesh | 0.0 /100 | #319 | Tragic 5.7% |
| Immigrants | Mexico | 0.0 /100 | #320 | Tragic 5.7% |
| British West Indians | 0.0 /100 | #321 | Tragic 5.8% |
| Natives/Alaskans | 0.0 /100 | #322 | Tragic 5.8% |
| Immigrants | Dominica | 0.0 /100 | #323 | Tragic 5.8% |
Demographics Similar to Chinese by Unemployment Among Seniors over 65 years
In terms of unemployment among seniors over 65 years, the demographic groups most similar to Chinese are Hmong (4.2%, a difference of 0.91%), Fijian (4.2%, a difference of 1.2%), Sudanese (4.4%, a difference of 5.0%), Chickasaw (4.4%, a difference of 5.0%), and Immigrants from Cuba (4.5%, a difference of 6.4%).
| Demographics | Rating | Rank | Unemployment Among Seniors over 65 years |
| Chinese | 100.0 /100 | #1 | Exceptional 4.2% |
| Hmong | 100.0 /100 | #2 | Exceptional 4.2% |
| Fijians | 100.0 /100 | #3 | Exceptional 4.2% |
| Sudanese | 100.0 /100 | #4 | Exceptional 4.4% |
| Chickasaw | 100.0 /100 | #5 | Exceptional 4.4% |
| Immigrants | Cuba | 100.0 /100 | #6 | Exceptional 4.5% |
| Immigrants | Congo | 100.0 /100 | #7 | Exceptional 4.5% |
| Tsimshian | 100.0 /100 | #8 | Exceptional 4.5% |
| Indonesians | 100.0 /100 | #9 | Exceptional 4.5% |
| Immigrants | Zaire | 100.0 /100 | #10 | Exceptional 4.5% |
| Comanche | 100.0 /100 | #11 | Exceptional 4.6% |
| Osage | 100.0 /100 | #12 | Exceptional 4.6% |
| Cubans | 100.0 /100 | #13 | Exceptional 4.6% |
| Menominee | 100.0 /100 | #14 | Exceptional 4.6% |
| Lumbee | 100.0 /100 | #15 | Exceptional 4.6% |