Paiute vs Chinese Unemployment Among Seniors over 65 years
COMPARE
Paiute
Chinese
Unemployment Among Seniors over 65 years
Unemployment Among Seniors over 65 years Comparison
Paiute
Chinese
6.3%
UNEMPLOYMENT AMONG SENIORS OVER 65 YEARS
0.0/ 100
METRIC RATING
339th/ 347
METRIC RANK
4.2%
UNEMPLOYMENT AMONG SENIORS OVER 65 YEARS
100.0/ 100
METRIC RATING
1st/ 347
METRIC RANK
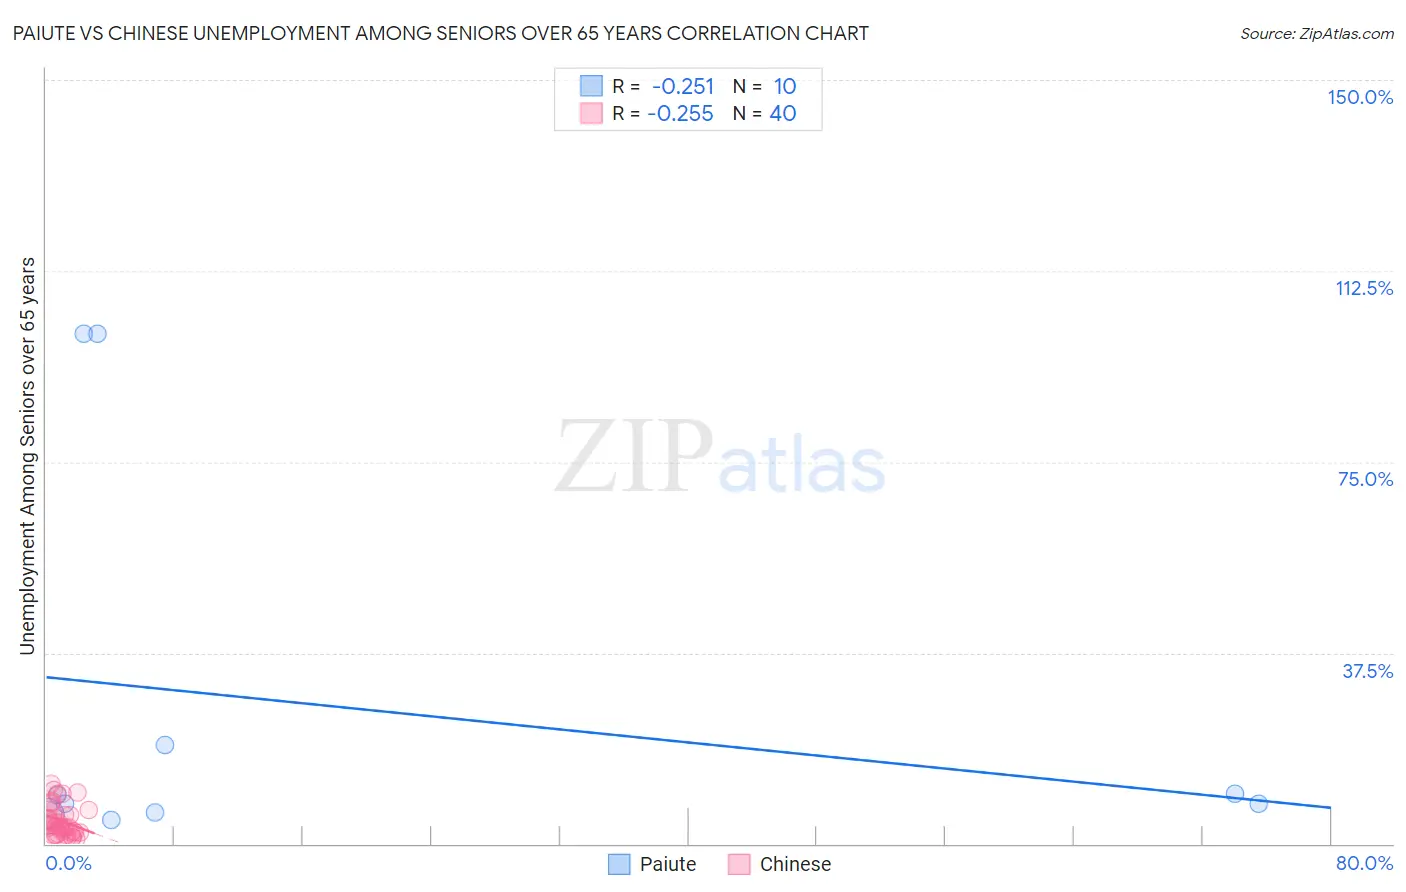
Paiute vs Chinese Unemployment Among Seniors over 65 years Correlation Chart
The statistical analysis conducted on geographies consisting of 56,841,036 people shows a weak negative correlation between the proportion of Paiute and unemployment rate amomg seniors over the age of 65 in the United States with a correlation coefficient (R) of -0.251 and weighted average of 6.3%. Similarly, the statistical analysis conducted on geographies consisting of 62,562,312 people shows a weak negative correlation between the proportion of Chinese and unemployment rate amomg seniors over the age of 65 in the United States with a correlation coefficient (R) of -0.255 and weighted average of 4.2%, a difference of 50.8%.
Unemployment Among Seniors over 65 years Correlation Summary
| Measurement | Paiute | Chinese |
| Minimum | 4.8% | 1.0% |
| Maximum | 100.1% | 11.9% |
| Range | 95.3% | 10.9% |
| Mean | 27.1% | 4.5% |
| Median | 8.7% | 3.5% |
| Interquartile 25% (IQ1) | 6.1% | 2.1% |
| Interquartile 75% (IQ3) | 19.3% | 5.7% |
| Interquartile Range (IQR) | 13.2% | 3.6% |
| Standard Deviation (Sample) | 38.7% | 3.0% |
| Standard Deviation (Population) | 36.7% | 2.9% |
Similar Demographics by Unemployment Among Seniors over 65 years
Demographics Similar to Paiute by Unemployment Among Seniors over 65 years
In terms of unemployment among seniors over 65 years, the demographic groups most similar to Paiute are Ute (6.3%, a difference of 0.060%), Immigrants from the Azores (6.3%, a difference of 0.27%), Alaska Native (6.3%, a difference of 0.44%), Pima (6.3%, a difference of 0.99%), and Immigrants from Armenia (6.2%, a difference of 2.8%).
| Demographics | Rating | Rank | Unemployment Among Seniors over 65 years |
| Aleuts | 0.0 /100 | #332 | Tragic 6.0% |
| Immigrants | Dominican Republic | 0.0 /100 | #333 | Tragic 6.0% |
| Tohono O'odham | 0.0 /100 | #334 | Tragic 6.1% |
| Immigrants | Armenia | 0.0 /100 | #335 | Tragic 6.2% |
| Pima | 0.0 /100 | #336 | Tragic 6.3% |
| Alaska Natives | 0.0 /100 | #337 | Tragic 6.3% |
| Immigrants | Azores | 0.0 /100 | #338 | Tragic 6.3% |
| Paiute | 0.0 /100 | #339 | Tragic 6.3% |
| Ute | 0.0 /100 | #340 | Tragic 6.3% |
| Yakama | 0.0 /100 | #341 | Tragic 6.7% |
| Navajo | 0.0 /100 | #342 | Tragic 6.7% |
| Tlingit-Haida | 0.0 /100 | #343 | Tragic 6.8% |
| Alaskan Athabascans | 0.0 /100 | #344 | Tragic 7.0% |
| Immigrants | Yemen | 0.0 /100 | #345 | Tragic 8.2% |
| Yup'ik | 0.0 /100 | #346 | Tragic 9.1% |
Demographics Similar to Chinese by Unemployment Among Seniors over 65 years
In terms of unemployment among seniors over 65 years, the demographic groups most similar to Chinese are Hmong (4.2%, a difference of 0.91%), Fijian (4.2%, a difference of 1.2%), Sudanese (4.4%, a difference of 5.0%), Chickasaw (4.4%, a difference of 5.0%), and Immigrants from Cuba (4.5%, a difference of 6.4%).
| Demographics | Rating | Rank | Unemployment Among Seniors over 65 years |
| Chinese | 100.0 /100 | #1 | Exceptional 4.2% |
| Hmong | 100.0 /100 | #2 | Exceptional 4.2% |
| Fijians | 100.0 /100 | #3 | Exceptional 4.2% |
| Sudanese | 100.0 /100 | #4 | Exceptional 4.4% |
| Chickasaw | 100.0 /100 | #5 | Exceptional 4.4% |
| Immigrants | Cuba | 100.0 /100 | #6 | Exceptional 4.5% |
| Immigrants | Congo | 100.0 /100 | #7 | Exceptional 4.5% |
| Tsimshian | 100.0 /100 | #8 | Exceptional 4.5% |
| Indonesians | 100.0 /100 | #9 | Exceptional 4.5% |
| Immigrants | Zaire | 100.0 /100 | #10 | Exceptional 4.5% |
| Comanche | 100.0 /100 | #11 | Exceptional 4.6% |
| Osage | 100.0 /100 | #12 | Exceptional 4.6% |
| Cubans | 100.0 /100 | #13 | Exceptional 4.6% |
| Menominee | 100.0 /100 | #14 | Exceptional 4.6% |
| Lumbee | 100.0 /100 | #15 | Exceptional 4.6% |