Immigrants from Canada vs Panamanian Unemployment Among Youth under 25 years
COMPARE
Immigrants from Canada
Panamanian
Unemployment Among Youth under 25 years
Unemployment Among Youth under 25 years Comparison
Immigrants from Canada
Panamanians
11.2%
UNEMPLOYMENT AMONG YOUTH UNDER 25 YEARS
96.7/ 100
METRIC RATING
79th/ 347
METRIC RANK
12.4%
UNEMPLOYMENT AMONG YOUTH UNDER 25 YEARS
0.2/ 100
METRIC RATING
257th/ 347
METRIC RANK
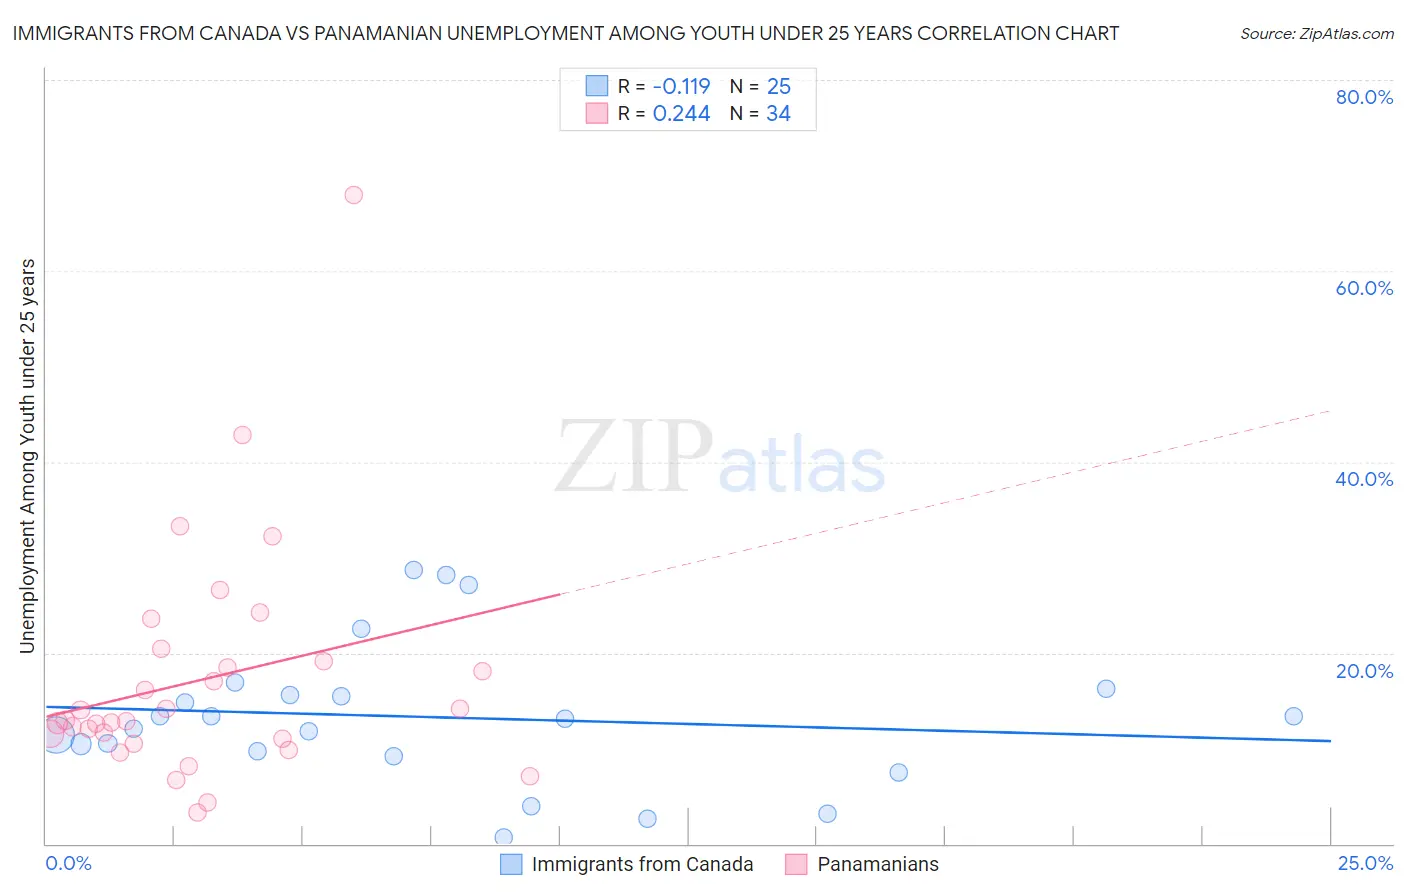
Immigrants from Canada vs Panamanian Unemployment Among Youth under 25 years Correlation Chart
The statistical analysis conducted on geographies consisting of 450,030,161 people shows a poor negative correlation between the proportion of Immigrants from Canada and unemployment rate among youth under the age of 25 in the United States with a correlation coefficient (R) of -0.119 and weighted average of 11.2%. Similarly, the statistical analysis conducted on geographies consisting of 279,636,521 people shows a weak positive correlation between the proportion of Panamanians and unemployment rate among youth under the age of 25 in the United States with a correlation coefficient (R) of 0.244 and weighted average of 12.4%, a difference of 10.5%.
Unemployment Among Youth under 25 years Correlation Summary
| Measurement | Immigrants from Canada | Panamanian |
| Minimum | 0.70% | 3.3% |
| Maximum | 28.7% | 67.9% |
| Range | 28.0% | 64.6% |
| Mean | 13.3% | 17.2% |
| Median | 13.1% | 12.9% |
| Interquartile 25% (IQ1) | 9.4% | 11.0% |
| Interquartile 75% (IQ3) | 15.9% | 19.1% |
| Interquartile Range (IQR) | 6.5% | 8.1% |
| Standard Deviation (Sample) | 7.4% | 12.3% |
| Standard Deviation (Population) | 7.3% | 12.1% |
Similar Demographics by Unemployment Among Youth under 25 years
Demographics Similar to Immigrants from Canada by Unemployment Among Youth under 25 years
In terms of unemployment among youth under 25 years, the demographic groups most similar to Immigrants from Canada are Immigrants from Nicaragua (11.2%, a difference of 0.010%), White/Caucasian (11.2%, a difference of 0.070%), Immigrants from Bulgaria (11.2%, a difference of 0.080%), German Russian (11.2%, a difference of 0.12%), and Icelander (11.2%, a difference of 0.13%).
| Demographics | Rating | Rank | Unemployment Among Youth under 25 years |
| Immigrants | Australia | 97.3 /100 | #72 | Exceptional 11.2% |
| Creek | 97.2 /100 | #73 | Exceptional 11.2% |
| New Zealanders | 97.2 /100 | #74 | Exceptional 11.2% |
| French | 97.1 /100 | #75 | Exceptional 11.2% |
| German Russians | 97.0 /100 | #76 | Exceptional 11.2% |
| Whites/Caucasians | 96.9 /100 | #77 | Exceptional 11.2% |
| Immigrants | Nicaragua | 96.7 /100 | #78 | Exceptional 11.2% |
| Immigrants | Canada | 96.7 /100 | #79 | Exceptional 11.2% |
| Immigrants | Bulgaria | 96.4 /100 | #80 | Exceptional 11.2% |
| Icelanders | 96.3 /100 | #81 | Exceptional 11.2% |
| Northern Europeans | 96.2 /100 | #82 | Exceptional 11.2% |
| Bolivians | 96.1 /100 | #83 | Exceptional 11.2% |
| French Canadians | 95.9 /100 | #84 | Exceptional 11.2% |
| Immigrants | South Central Asia | 95.9 /100 | #85 | Exceptional 11.2% |
| Immigrants | South Africa | 95.8 /100 | #86 | Exceptional 11.2% |
Demographics Similar to Panamanians by Unemployment Among Youth under 25 years
In terms of unemployment among youth under 25 years, the demographic groups most similar to Panamanians are Liberian (12.4%, a difference of 0.010%), Salvadoran (12.4%, a difference of 0.030%), Hispanic or Latino (12.4%, a difference of 0.080%), Immigrants from Central America (12.4%, a difference of 0.080%), and Immigrants from Panama (12.4%, a difference of 0.38%).
| Demographics | Rating | Rank | Unemployment Among Youth under 25 years |
| Delaware | 0.4 /100 | #250 | Tragic 12.3% |
| Mexican American Indians | 0.4 /100 | #251 | Tragic 12.3% |
| Immigrants | Syria | 0.3 /100 | #252 | Tragic 12.3% |
| Mexicans | 0.3 /100 | #253 | Tragic 12.3% |
| Hondurans | 0.3 /100 | #254 | Tragic 12.3% |
| Hispanics or Latinos | 0.2 /100 | #255 | Tragic 12.4% |
| Liberians | 0.2 /100 | #256 | Tragic 12.4% |
| Panamanians | 0.2 /100 | #257 | Tragic 12.4% |
| Salvadorans | 0.1 /100 | #258 | Tragic 12.4% |
| Immigrants | Central America | 0.1 /100 | #259 | Tragic 12.4% |
| Immigrants | Panama | 0.1 /100 | #260 | Tragic 12.4% |
| Immigrants | El Salvador | 0.1 /100 | #261 | Tragic 12.4% |
| Immigrants | Mexico | 0.1 /100 | #262 | Tragic 12.4% |
| Cree | 0.1 /100 | #263 | Tragic 12.4% |
| Puget Sound Salish | 0.1 /100 | #264 | Tragic 12.5% |