Immigrants from Canada vs Immigrants from St. Vincent and the Grenadines Unemployment Among Youth under 25 years
COMPARE
Immigrants from Canada
Immigrants from St. Vincent and the Grenadines
Unemployment Among Youth under 25 years
Unemployment Among Youth under 25 years Comparison
Immigrants from Canada
Immigrants from St. Vincent and the Grenadines
11.2%
UNEMPLOYMENT AMONG YOUTH UNDER 25 YEARS
96.7/ 100
METRIC RATING
79th/ 347
METRIC RANK
16.1%
UNEMPLOYMENT AMONG YOUTH UNDER 25 YEARS
0.0/ 100
METRIC RATING
335th/ 347
METRIC RANK
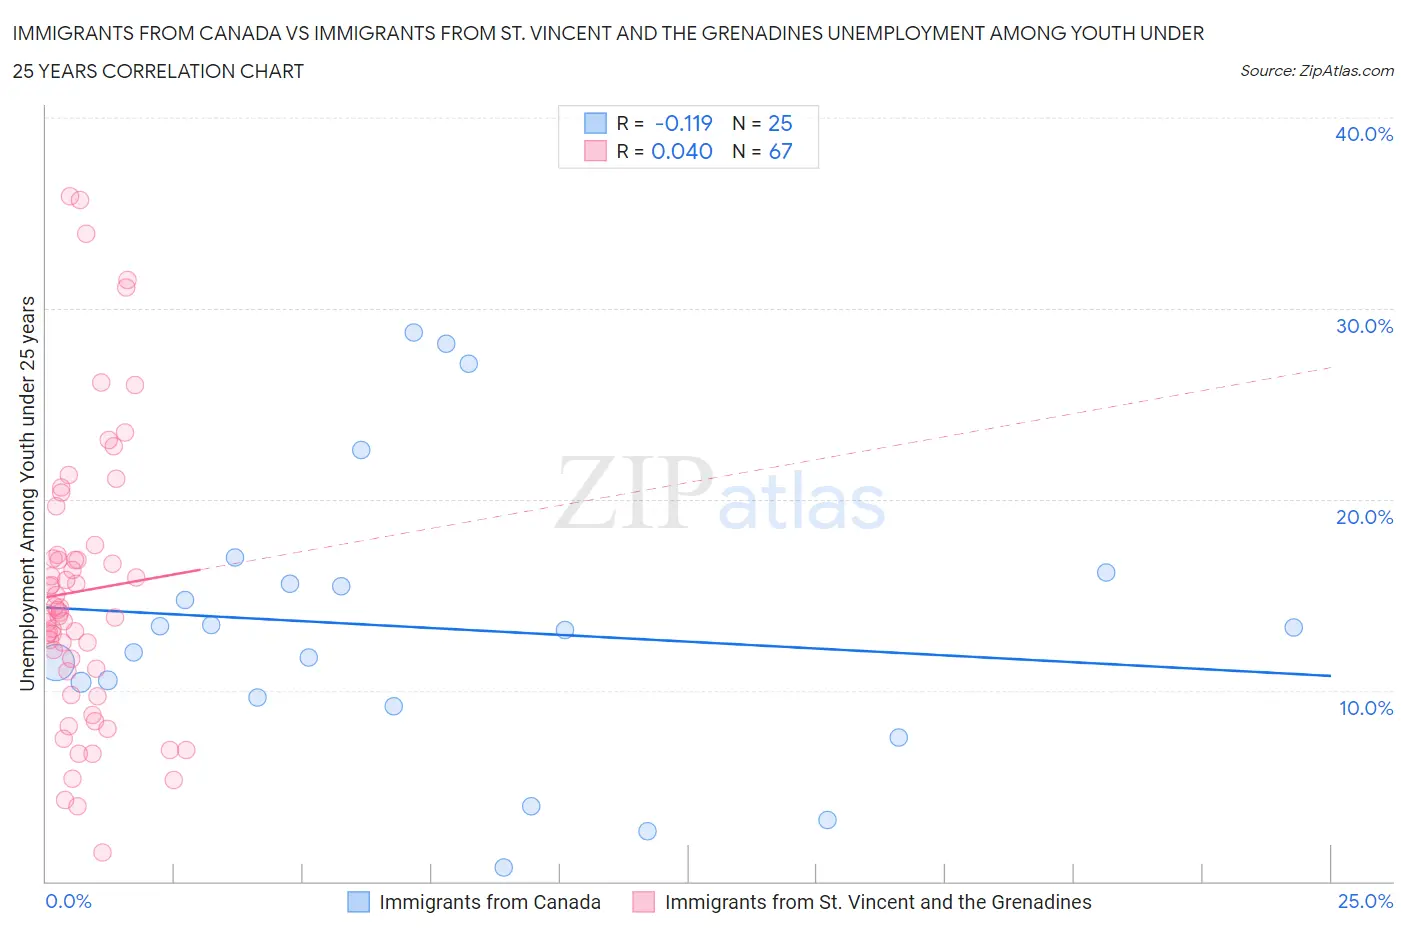
Immigrants from Canada vs Immigrants from St. Vincent and the Grenadines Unemployment Among Youth under 25 years Correlation Chart
The statistical analysis conducted on geographies consisting of 450,030,161 people shows a poor negative correlation between the proportion of Immigrants from Canada and unemployment rate among youth under the age of 25 in the United States with a correlation coefficient (R) of -0.119 and weighted average of 11.2%. Similarly, the statistical analysis conducted on geographies consisting of 56,125,672 people shows no correlation between the proportion of Immigrants from St. Vincent and the Grenadines and unemployment rate among youth under the age of 25 in the United States with a correlation coefficient (R) of 0.040 and weighted average of 16.1%, a difference of 44.1%.
Unemployment Among Youth under 25 years Correlation Summary
| Measurement | Immigrants from Canada | Immigrants from St. Vincent and the Grenadines |
| Minimum | 0.70% | 1.5% |
| Maximum | 28.7% | 35.9% |
| Range | 28.0% | 34.4% |
| Mean | 13.3% | 15.2% |
| Median | 13.1% | 14.0% |
| Interquartile 25% (IQ1) | 9.4% | 11.0% |
| Interquartile 75% (IQ3) | 15.9% | 17.1% |
| Interquartile Range (IQR) | 6.5% | 6.0% |
| Standard Deviation (Sample) | 7.4% | 7.4% |
| Standard Deviation (Population) | 7.3% | 7.4% |
Similar Demographics by Unemployment Among Youth under 25 years
Demographics Similar to Immigrants from Canada by Unemployment Among Youth under 25 years
In terms of unemployment among youth under 25 years, the demographic groups most similar to Immigrants from Canada are Immigrants from Nicaragua (11.2%, a difference of 0.010%), White/Caucasian (11.2%, a difference of 0.070%), Immigrants from Bulgaria (11.2%, a difference of 0.080%), German Russian (11.2%, a difference of 0.12%), and Icelander (11.2%, a difference of 0.13%).
| Demographics | Rating | Rank | Unemployment Among Youth under 25 years |
| Immigrants | Australia | 97.3 /100 | #72 | Exceptional 11.2% |
| Creek | 97.2 /100 | #73 | Exceptional 11.2% |
| New Zealanders | 97.2 /100 | #74 | Exceptional 11.2% |
| French | 97.1 /100 | #75 | Exceptional 11.2% |
| German Russians | 97.0 /100 | #76 | Exceptional 11.2% |
| Whites/Caucasians | 96.9 /100 | #77 | Exceptional 11.2% |
| Immigrants | Nicaragua | 96.7 /100 | #78 | Exceptional 11.2% |
| Immigrants | Canada | 96.7 /100 | #79 | Exceptional 11.2% |
| Immigrants | Bulgaria | 96.4 /100 | #80 | Exceptional 11.2% |
| Icelanders | 96.3 /100 | #81 | Exceptional 11.2% |
| Northern Europeans | 96.2 /100 | #82 | Exceptional 11.2% |
| Bolivians | 96.1 /100 | #83 | Exceptional 11.2% |
| French Canadians | 95.9 /100 | #84 | Exceptional 11.2% |
| Immigrants | South Central Asia | 95.9 /100 | #85 | Exceptional 11.2% |
| Immigrants | South Africa | 95.8 /100 | #86 | Exceptional 11.2% |
Demographics Similar to Immigrants from St. Vincent and the Grenadines by Unemployment Among Youth under 25 years
In terms of unemployment among youth under 25 years, the demographic groups most similar to Immigrants from St. Vincent and the Grenadines are Pima (16.2%, a difference of 0.64%), Arapaho (16.3%, a difference of 0.80%), Yuman (16.3%, a difference of 1.1%), Immigrants from Guyana (15.9%, a difference of 1.3%), and Guyanese (15.9%, a difference of 1.6%).
| Demographics | Rating | Rank | Unemployment Among Youth under 25 years |
| Immigrants | Dominican Republic | 0.0 /100 | #328 | Tragic 15.6% |
| Immigrants | Yemen | 0.0 /100 | #329 | Tragic 15.6% |
| Yakama | 0.0 /100 | #330 | Tragic 15.6% |
| Dominicans | 0.0 /100 | #331 | Tragic 15.7% |
| Immigrants | Grenada | 0.0 /100 | #332 | Tragic 15.8% |
| Guyanese | 0.0 /100 | #333 | Tragic 15.9% |
| Immigrants | Guyana | 0.0 /100 | #334 | Tragic 15.9% |
| Immigrants | St. Vincent and the Grenadines | 0.0 /100 | #335 | Tragic 16.1% |
| Pima | 0.0 /100 | #336 | Tragic 16.2% |
| Arapaho | 0.0 /100 | #337 | Tragic 16.3% |
| Yuman | 0.0 /100 | #338 | Tragic 16.3% |
| Tsimshian | 0.0 /100 | #339 | Tragic 16.5% |
| Colville | 0.0 /100 | #340 | Tragic 16.8% |
| Paiute | 0.0 /100 | #341 | Tragic 17.6% |
| Puerto Ricans | 0.0 /100 | #342 | Tragic 18.4% |