Immigrants from Canada vs Immigrants from Greece Unemployment Among Youth under 25 years
COMPARE
Immigrants from Canada
Immigrants from Greece
Unemployment Among Youth under 25 years
Unemployment Among Youth under 25 years Comparison
Immigrants from Canada
Immigrants from Greece
11.2%
UNEMPLOYMENT AMONG YOUTH UNDER 25 YEARS
96.7/ 100
METRIC RATING
79th/ 347
METRIC RANK
12.2%
UNEMPLOYMENT AMONG YOUTH UNDER 25 YEARS
0.6/ 100
METRIC RATING
247th/ 347
METRIC RANK
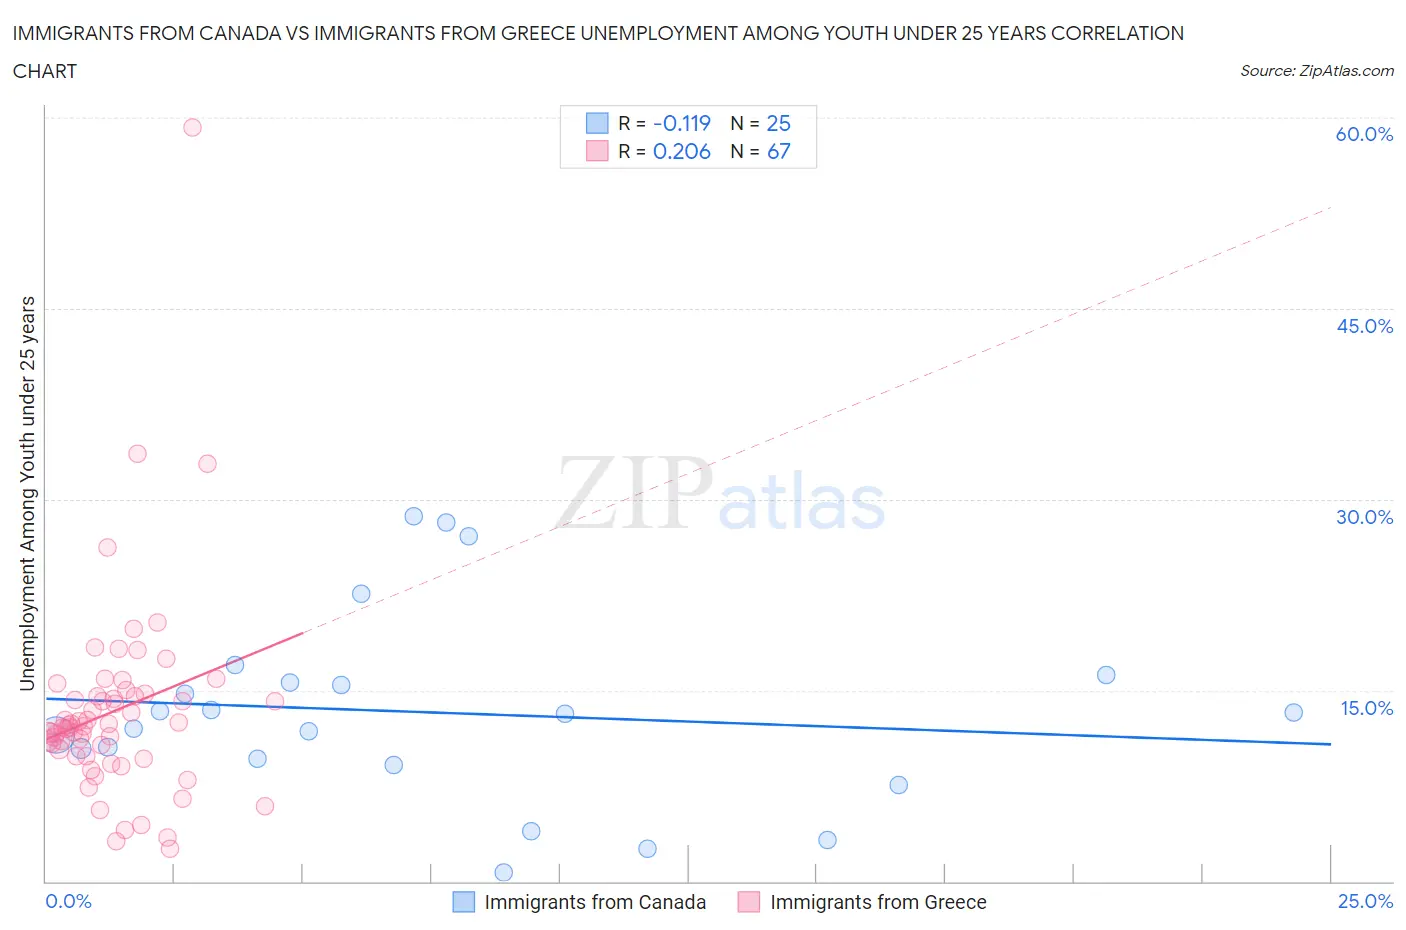
Immigrants from Canada vs Immigrants from Greece Unemployment Among Youth under 25 years Correlation Chart
The statistical analysis conducted on geographies consisting of 450,030,161 people shows a poor negative correlation between the proportion of Immigrants from Canada and unemployment rate among youth under the age of 25 in the United States with a correlation coefficient (R) of -0.119 and weighted average of 11.2%. Similarly, the statistical analysis conducted on geographies consisting of 215,357,272 people shows a weak positive correlation between the proportion of Immigrants from Greece and unemployment rate among youth under the age of 25 in the United States with a correlation coefficient (R) of 0.206 and weighted average of 12.2%, a difference of 9.1%.
Unemployment Among Youth under 25 years Correlation Summary
| Measurement | Immigrants from Canada | Immigrants from Greece |
| Minimum | 0.70% | 2.6% |
| Maximum | 28.7% | 59.2% |
| Range | 28.0% | 56.6% |
| Mean | 13.3% | 13.4% |
| Median | 13.1% | 12.2% |
| Interquartile 25% (IQ1) | 9.4% | 9.9% |
| Interquartile 75% (IQ3) | 15.9% | 14.6% |
| Interquartile Range (IQR) | 6.5% | 4.7% |
| Standard Deviation (Sample) | 7.4% | 8.0% |
| Standard Deviation (Population) | 7.3% | 7.9% |
Similar Demographics by Unemployment Among Youth under 25 years
Demographics Similar to Immigrants from Canada by Unemployment Among Youth under 25 years
In terms of unemployment among youth under 25 years, the demographic groups most similar to Immigrants from Canada are Immigrants from Nicaragua (11.2%, a difference of 0.010%), White/Caucasian (11.2%, a difference of 0.070%), Immigrants from Bulgaria (11.2%, a difference of 0.080%), German Russian (11.2%, a difference of 0.12%), and Icelander (11.2%, a difference of 0.13%).
| Demographics | Rating | Rank | Unemployment Among Youth under 25 years |
| Immigrants | Australia | 97.3 /100 | #72 | Exceptional 11.2% |
| Creek | 97.2 /100 | #73 | Exceptional 11.2% |
| New Zealanders | 97.2 /100 | #74 | Exceptional 11.2% |
| French | 97.1 /100 | #75 | Exceptional 11.2% |
| German Russians | 97.0 /100 | #76 | Exceptional 11.2% |
| Whites/Caucasians | 96.9 /100 | #77 | Exceptional 11.2% |
| Immigrants | Nicaragua | 96.7 /100 | #78 | Exceptional 11.2% |
| Immigrants | Canada | 96.7 /100 | #79 | Exceptional 11.2% |
| Immigrants | Bulgaria | 96.4 /100 | #80 | Exceptional 11.2% |
| Icelanders | 96.3 /100 | #81 | Exceptional 11.2% |
| Northern Europeans | 96.2 /100 | #82 | Exceptional 11.2% |
| Bolivians | 96.1 /100 | #83 | Exceptional 11.2% |
| French Canadians | 95.9 /100 | #84 | Exceptional 11.2% |
| Immigrants | South Central Asia | 95.9 /100 | #85 | Exceptional 11.2% |
| Immigrants | South Africa | 95.8 /100 | #86 | Exceptional 11.2% |
Demographics Similar to Immigrants from Greece by Unemployment Among Youth under 25 years
In terms of unemployment among youth under 25 years, the demographic groups most similar to Immigrants from Greece are Central American (12.2%, a difference of 0.010%), Soviet Union (12.2%, a difference of 0.020%), Spanish American (12.2%, a difference of 0.11%), Immigrants from Honduras (12.2%, a difference of 0.11%), and Alaskan Athabascan (12.2%, a difference of 0.12%).
| Demographics | Rating | Rank | Unemployment Among Youth under 25 years |
| Dutch West Indians | 1.1 /100 | #240 | Tragic 12.1% |
| Immigrants | Albania | 1.1 /100 | #241 | Tragic 12.1% |
| Immigrants | Western Asia | 0.8 /100 | #242 | Tragic 12.2% |
| Immigrants | Azores | 0.6 /100 | #243 | Tragic 12.2% |
| Alaskan Athabascans | 0.6 /100 | #244 | Tragic 12.2% |
| Spanish Americans | 0.6 /100 | #245 | Tragic 12.2% |
| Immigrants | Honduras | 0.6 /100 | #246 | Tragic 12.2% |
| Immigrants | Greece | 0.6 /100 | #247 | Tragic 12.2% |
| Central Americans | 0.6 /100 | #248 | Tragic 12.2% |
| Soviet Union | 0.6 /100 | #249 | Tragic 12.2% |
| Delaware | 0.4 /100 | #250 | Tragic 12.3% |
| Mexican American Indians | 0.4 /100 | #251 | Tragic 12.3% |
| Immigrants | Syria | 0.3 /100 | #252 | Tragic 12.3% |
| Mexicans | 0.3 /100 | #253 | Tragic 12.3% |
| Hondurans | 0.3 /100 | #254 | Tragic 12.3% |